2018 was an unusually volatile market with all hell breaking loose in the 4th quarter. If we need an explanation, the catalysts would again be the Fed raising interest rates, tariffs, trade agreements with China, Mexico and Canada, domestic and international political unrest, etc. And, it is indeed odd that this happened when the economy is still in relatively good shape. For example, in December 77% more new non-farm jobs were created versus the prior period. If the economy had any impact on the market, it would be because the troublemakers made up any and all excuses to scare investors into thinking that the economy is weakening, thus causing a sell off. Then the fat kats come back in and buy at prices much lower than what would have been possible before.
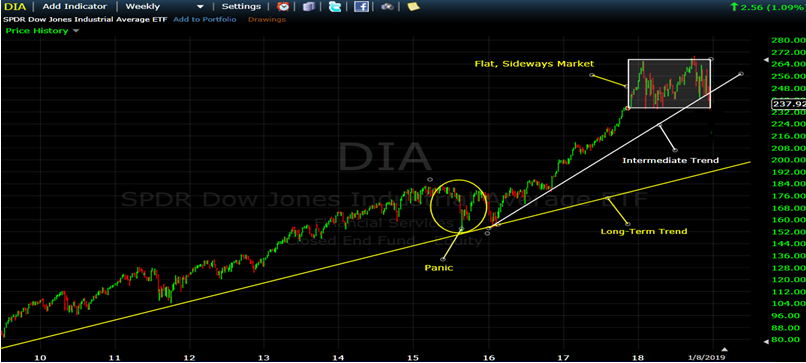
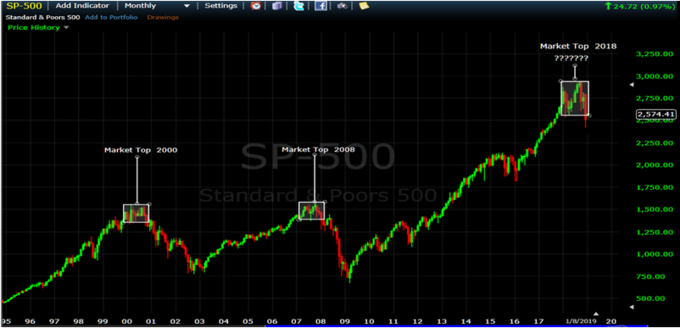
That said, the market is beginning to look like it is entering a “topping" pattern that we have seen before in each and every major market crash in the last 20+ years. In 2015, the Global Central Bank interventions prevented or postponed a crash. Crashes don’t normally happen suddenly and quickly; they usually waffle in a tight trading range (like plus to minus 6 to 7%), and then they drop like a rock. Is that what is happening now? I don’t know, but we should find out in a relatively short period of time from here.
.
The 4th Quarter was a Disaster !!!
Meet the monster…
The market volatility type in 4Q'18 is one of the most difficult for quantitative models.
Some of the major problems weree:
1) Trendless - a flat or sideways market has no trend. The slope of the trend is near zero, so any small
deviation from the trend could seem to signal a "direction change", and this can lead to a series of
“whipsaws”.
2) Oversold and overbought conditions do not register nearly as often as the market changes direction
quickly.
3) Reversion to the mean signals could trigger at tops in sideways patterns that happen in an up market,
but they rarely trigger on market bottoms in these type markets.
4) Since most models available to large individual investors and RIAs are based on daily data (instead
of like minute-by-minute or second-by-second data), it can take a few days for models to issue a new
buy/sell/cash signal. And, when sideways markets are changing direction every few days (high-
frequency-directional-changes), the market can change direction a day or two after each trade is
executed, time after time. We all know what that leads to, and it is NOT pretty.
MIPS Performance in 2018…
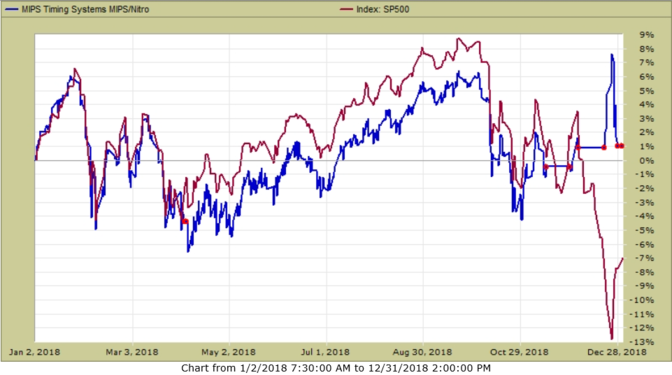
Actually, MIPS performed OK in 2018 (like, did not lose money in a down market). MIPS was up about +1%, while the S&P 500 was down about -7%. Many other quantitative models took a beating in 2018.
From TimerTrac.com MIPS +1% Standard & Poors 500 -7%
Red dots represent "trades"...
Here Comes 2019…
2019 is starting off with a Bang...
.
China remains a headache but it is not overbearing. And, our economy remains strong.
There are billions of dollars flowing back into the market so far in Jan’19. The market got a boost from the Fed after Chairman Powell said the Feb will be “flexible and patient" regarding rate hikes in 2019. Last Friday, earnings reports showed 312,000 new jobs created in December versus 155,000 created in November, and 180,000 “expected” in December. Can’t beat that !!!
In 4Q’18, Corporate earnings growth has average 15.4%, with Corporate revenue growth of 6.2%. Average hourly wages rose 0.4%, the largest gain in 4 months. The year-over-year wages growth is about 3.1%.
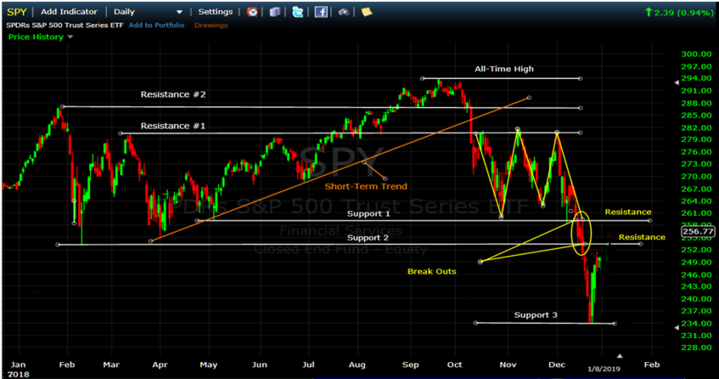
After a strong recovery in the last four days in Dec’18 and in the first six days in Jan’19, the SPY has “recaptured” a little over 50% of the “drop” that started in early Dec’18. See graph and text below...
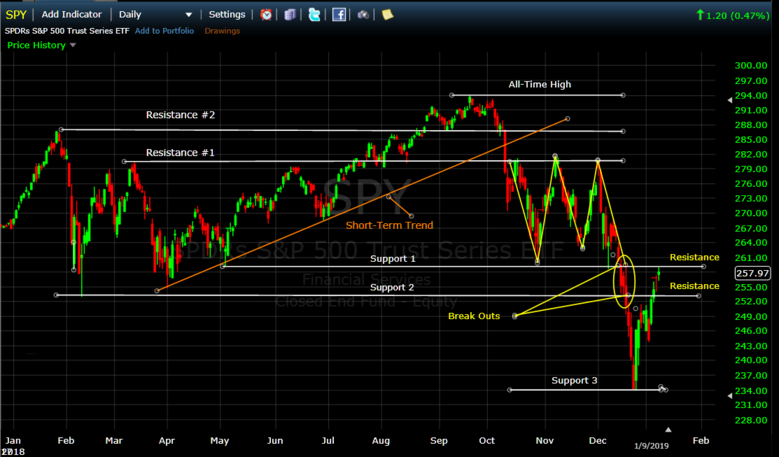
The challenge going forward is for the SPY to break above the second Resistance levels on the right hand side of the graph above. On Monday (Jan 7th) the SPY broke above its first Resistance level at 253.1; and then it stalled right on the second Resistance at 259.1 today (Jan 9th). It is highly likely that the SPY may stall at this level for a few days or even drop back below it.
On the other hand, if the SPY breaks above 259.1, it would most likely move up significantly to test its higher resistance levels shown above (or even move into new high territory). Although not expected at this time, the SPY could of course, just as easily head back down to test the support levels below today’s price. That could result in a drop to 234.1, or lower. And, it if breaks that level, we will head for the hills (that is, go Short and make money).
Stay tuned. It’s anybody’s guess, but MIPS is watching…
Good Trading…
Paul Distefano, PhD
CEO / Founder
MIPS Timing Systems, LLC
Houston, TX
www.mipstiming.com
281-251-MIPS(6477)


