Over the last 12 years, the MIPS models have traded an average of roughly 12-15 trades/year, depending on the model. But remember, an average of 12 trades/year over time can be 2-6 trades in some years and 15-20 trades/year in others.
When a timing model averages 12 trades/year, its Signal Life is about 30 days (one month). This is why MIPS is referred to as an Intermediate-Term trading model; whereas a model that makes 50 trades/year
with a signal life of about one week or 5 days, is a Short-Term trading model.
Good models only trade when the conditions that they are based upon change. For example, MIPS is basically a "Trend Following" model and will usually not change its Long or Short signals until the intermediate-term trend changes direction. I say "usually" because there are times when some the other indicators in MIPS (like, reversion-to-the-mean, overbought/sold, etc.) may override the trend signals.
The MIPS "Voting Tree"
MIPS is a VERY complicated, analytical model that uses over 150 indicators (some commercial, others proprietary) and a robust decision making process to ascertain if the market is climbing or diving. The math that we use includes artificial intelligence, pattern recognition, and self-developed applied mathematical algorithms (slopes, 2nd derivatives, rate-of-change, inflection points, etc.). The MIPS4 and Nitro models also use some "predictive algorithms" that anticipate changes in the markets a day or two before it happens. Gaining one day on both sides of each trade can make a significant difference in performance.
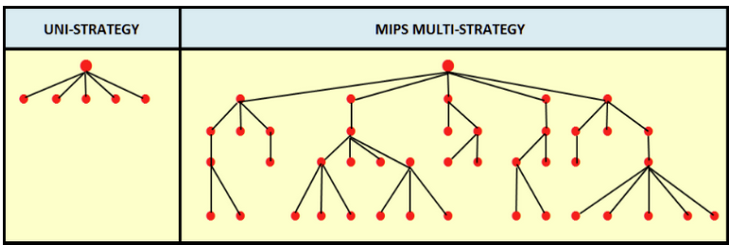
The main ingredient that we use to generate signals from our models comes mainly from the positions (Long/Short/Cash) of each and every one of our 150 Indicators. But, the process we developed does NOT simply add the positions of all of the 150 Indicators, and let the majority prevail. For example, if 77 of the Indicators are Long and 73 are short, using a Uni-Strategy voting process the consensus would be Long, but that is NOT where we stop.
The MIPS models actually use what we call a Multi-Strategy voting process, as depicted below. Please be aware that this is a simplified picture, and is less than 1/10th of the complexity used in the MIPS models. The raw 150 Indicators that we have been discussing start on the very bottom of each leg in the voting tree and they consolidate through a proprietary process that leads to a preliminary Signal decision at the very top. The indicators that are in the finals in the voting process, which we call the Super Indicators, are in the first line below the final Preliminary Signal. In the MIPS models, we use 15 Super Indicators.
These 15 Super Indicators form what we call our Core Model. We call the signals from the core models preliminary signals, and they are the base for each MIPS model. From here, algorithms that are specifically designed for each MIPS model convert the core model signals ("preliminary signals") into the final signals for each MIPS model. Going from preliminary signals to final signals for each MIPS model is a complicated, but it is a well defined process. And, it includes specific algorithms that basically define each MIPS model. Please understand that this algorithm is run on a daily basis. In less than 2-3 seconds, MIPS calculates what would take a human over 48 hours to calculate and analyze.
................................................................................. MIPS "Voting Tree"
ACTUAL MIPS SIGNALS IN 2016-2017
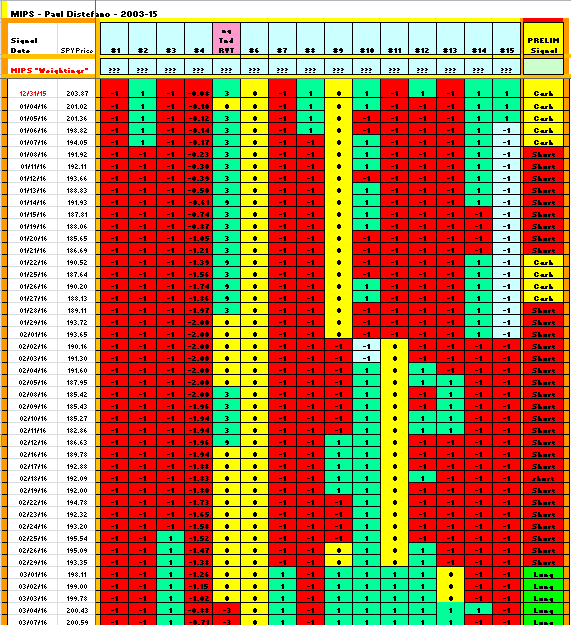
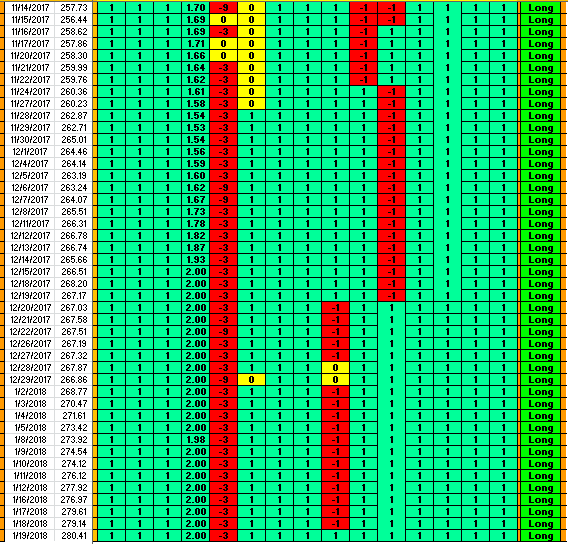
At the bottom of this Blog, you will see a sample of the daily PRELIM signals for the MIPS Core Model since December 31, 2015 (column on the far right in the table); and a table containing a "sample" of what the MIPS Super Indicators that make it to Vote Line looked like in in early 2016 and in late 2017. From this, you will see the Core Model getting stronger-and-stronger Long as we reach today's date.
The information from the MIPS core model is a major part of the final signals for all of the MIPS models. The numbers in the table at the bottom of this Blog are the foundation for the signals from all MIPS models, but are not necessarily the final word for any. At any rate, the numbers basically show the strength of all of the Super Indicators daily.
From the table at the end of this Blog, you can see that:
a) the majority of the vote-line Super Indicators were Long for the last half of 2016 and the entire
year of 2017, and
b) the "reversion-to-the-mean" indicator is getting more negative with time.
Remember, we use over 150 sub-indicators, so each of the Super Indicators on the Vote Line are the consensus of an average of 10 sub-indicators beneath them. In actuality, the Super Indicators on the Vote Line daily are fed by 3-20 sub-indicators each. Note: This is the only time that we have exposed any part of the actual guts of the MIPS core model, so please do not share it.
NEVER BEFORE
With the above in mind, all of the MIPS models have remained LONG for over 12 months (some up to 18 months). I have been developing mathematical models to time the market for almost 20 years for myself and family, and MIPS3 itself went "public" in November 2005. And, I have NEVER experienced model behavior anywhere even close to what is happening now since the 1990's (and we know how that ended).
Even though the MIPS models have been Long for over one year, three of us here at MIPS Timing Systems still input data daily, run-the models each and every day, and compare our results before we send out signal emails to our MIPS Members. We take no "breaks", nor do we spend any less effort, regardless of whether or not a model issues a new signal on any day or keeps the existing one.
The daily positions (long/short/cash) from the MIPS models depend upon the position of each and every Indicator that we use, although not on a one-to-one basis. Each Indicator earns its own weighting in the voting system, based mainly by examining its own past performance (using artificial intelligence algorithms). That notwithstanding, the MIPS models are definitely "stronger" when the majority of the Super Indicators show the same position (long/short/cash).
WHAT WOULD YOU DO?
In conjunction with the above and given the facts below, what would you do?
(a) Corporate profits from large cap stocks have been growing at a rate not seen in the last 10 years,
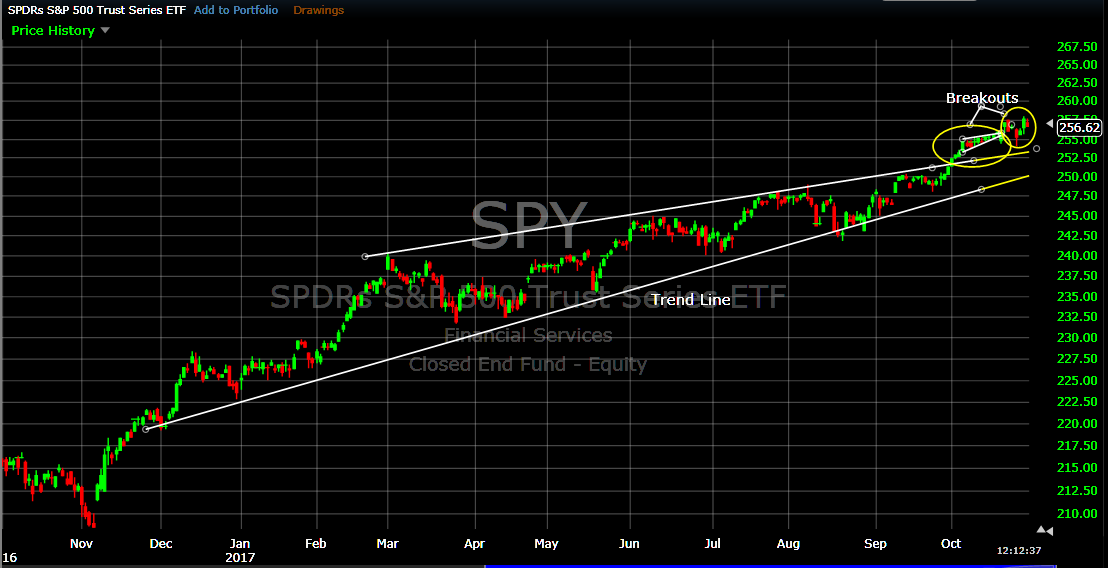
(b) The SPY 500 has gone almost straight up daily over the last 12-15 months with very low volatility.
Would anyone expect a good investor or a good timing model to get out of the market (or go short)?
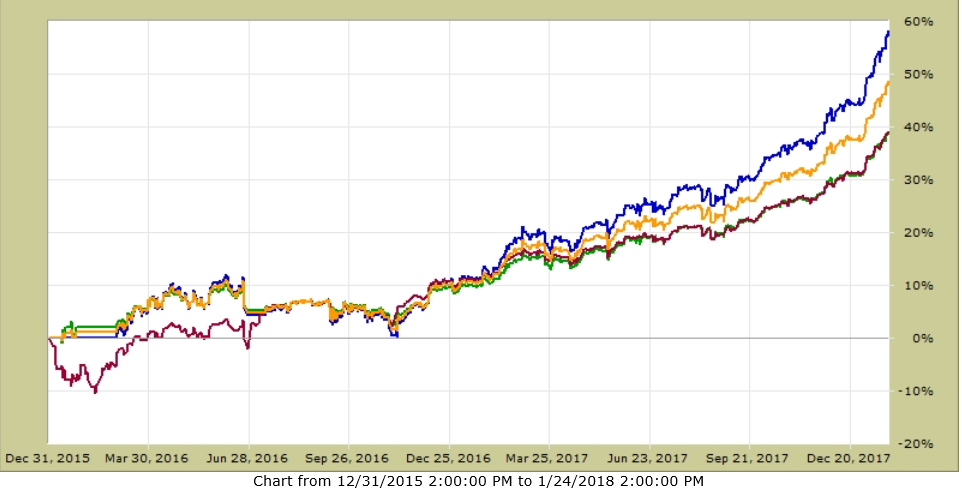
2016-17 MIPS/NITRO PERFORMANCE
....................(Long - Short Leverage)
MIPS/Nitro (1.50x - 0.5x leverage) +58%
MIPS/Nitro (1.25x- 0.5x leverage) +49%
MIPS/Nitro (1.00x -1.0x leverage) +39%
SPY................................................. +39%
Some MIPS Members are worried because the MIPS models have been Long for over 18 months. Most of the time, worrying would be the right thing to do. Most models that do well in up markets, do poorly in down markets. And, a lot of the time, this means that these models have an up-bias and the developer is not even aware of it.
ANY GOOD MODEL MUST DO WELL IN UP AND DOWN MARKETS, and MIPS is one of them. We continually test our MIPS models with decaying market performance data to see how fast MIPS would pick up the drops; and how well (and fast) it performs at the turn-around point. On these, MIPS has an excellent batting average..
2008 MIPS3 PERFORMANCE
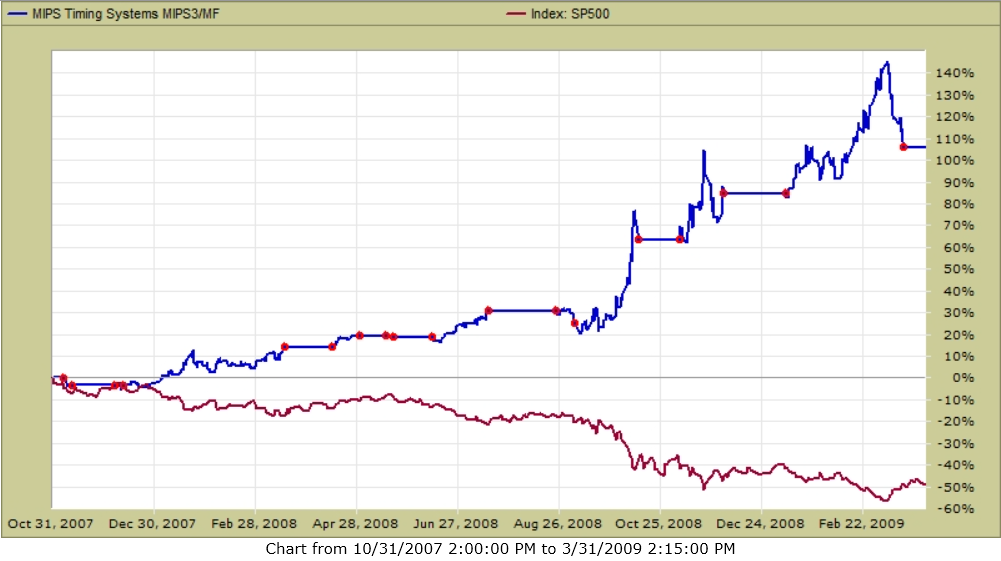
Thankfully, we do not have to guess how MIPS would have done in a market crash like 2008, because MIPS3 was LIVE in 2008 and was being tracked by TimerTrac.com. MIPS3's 2008 performance is shown below (hard to beat):
MIPS3 in 2008 (red dots designate trade dates)
MIPS +108% SPY -50%
==============================================================================
The MIPS Models' Super Indicators and "Core Model" Signals
EARLY 2016
.
.
.
LATE 2017 (and now)
Good Trading...
Paul Distefano, PhD
MIPS Timing Systems, LLC
Houston, TX
281-251-MIPS(6477)
www.mipstiming.com


