Please review our previous email below from 1/27/2016 (Beware the Bear !!!), or you may have trouble understanding this one.
In the previous email, we included a:
#1 daily graph,
#2 weekly graph, and
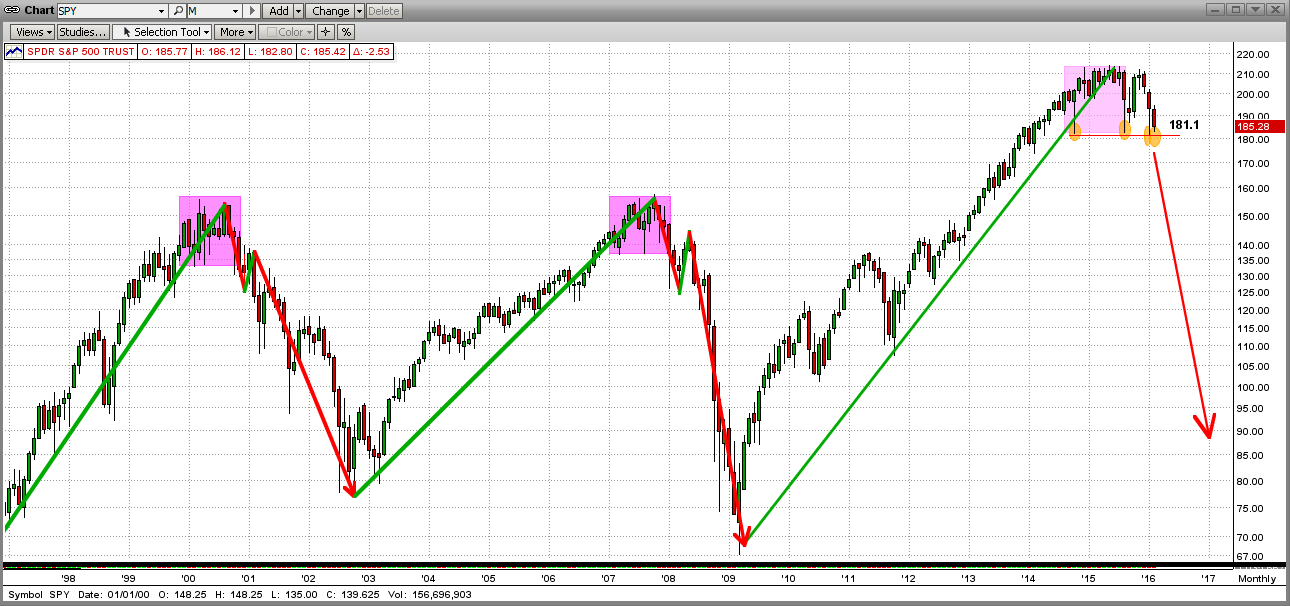
#3 monthly graph
in order to show how the SPY has been breaking all support to the downside starting at a high of 214.0 in 2015 (approx 2140 on the S&P 500). Today, the SPY broke to the downside through a very important support level at 187.0 that it had touched, and bounced back up from, 4 times in the last 8 trading days !!!
Today's breakthrough started with force (S&P500 down 50 points), but the SPY bounced back up after touching the next very important support level at about 182.4 (not a good sign for the Bears). In fact, this could be interpreted as a "one-day key reversal"; where the SPY could change direction and head back up from here for a while. Read on...
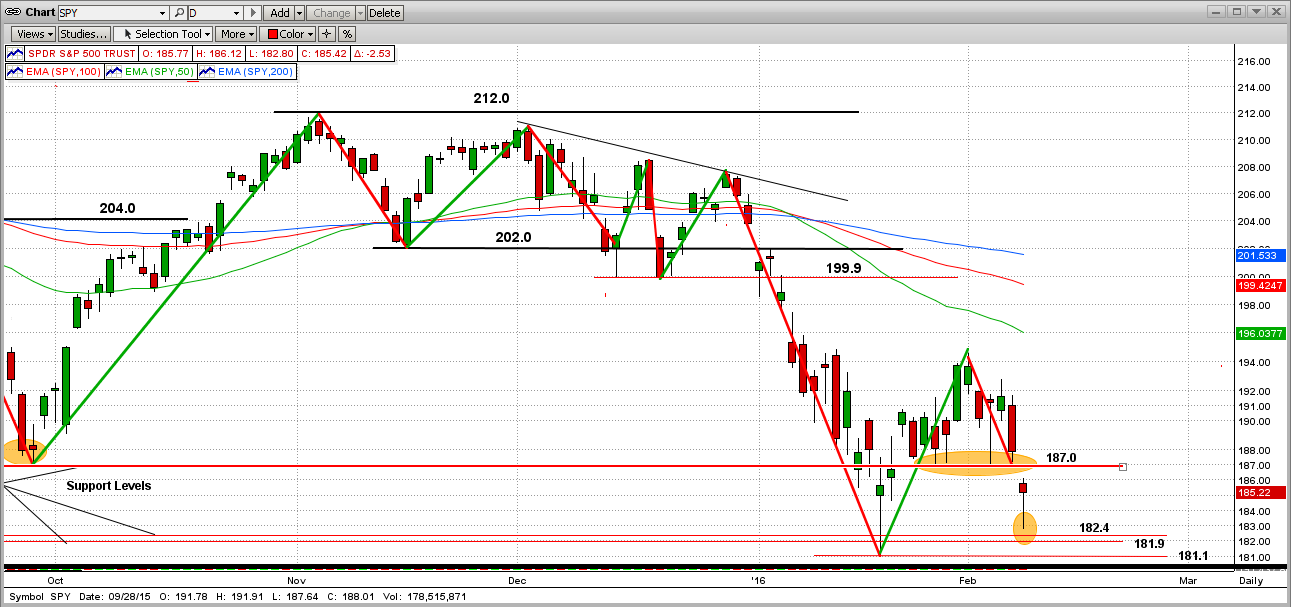
Or, maybe the bears will get aggressive and charge ("test") the last strong support level at 181.1. If the SPY does break below 181.1 with force (after 4 tries now) and stays below for a few days, this could be the start of the big drop we have been keeping you aware of. This, of course, would not be pretty for most investors, but MIPS is on the verge of a going short now, and would quickly identify and short the big drop. If this does happen, the graph below shows what the SPY could look like over the next few weeks/months.
Stay tuned !!!


