Sunday, July 21 2013
Our previous entry discussed Ben Bernanke's influence on the market. This entry summarizes the results.
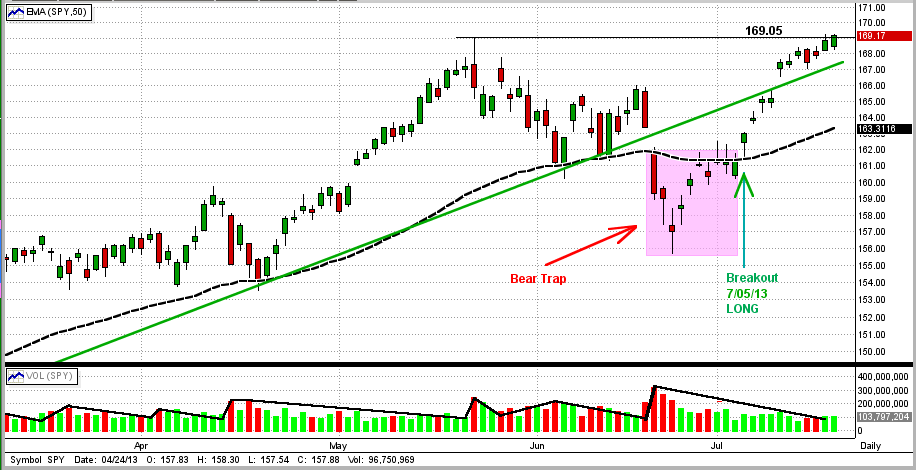
In the graph below, we can see:
1) MIPS followed a 6-month uptrend in the SPY
2) MIPS, along with other timing models, got caught in a short "Bear Trap" (pink rectangle)
3) This included a sharp drop followed by a one-day key reversal on 6/24/13 and a 6-day sideways
consolidation pattern before breaking up on 7/5/13.
So, what does this new uptrend have to do with Helicopter Ben? Read on...

|
UPDATE
It seems as though no one has a strong feeling for where this market will go from here. The market has hit all-time closing highs in the major indices and the retail investors (the "little guys") are rushing back into a market that they missed to the tune of over $100 billion per quarter. As always, a large number of issues/circumstances should determine the market's moves from here. But, is this true now?
One could make a strong case that the market behavior from here is not dependent upon the tens of thousands of institutional investors/traders or hundreds of millions of little guys, etc., but mainly on the actions of one man, Ben Bernanke, Chairman of the Federal Reserve.
Supposedly to stimulate the economy, Helicopter Ben is printing $85 billion dollars every month with no end in sight. Our national debt rose by over $1 trillion last year, and we have more debt now than all of the countries in the European Union combined. This will ultimately throw everything into chaos. At this time, the USA can afford the interest payments on our national debt ONLY because Helicopter Ben is keeping interest rates on US Treasury bonds artificially low ("Operation Twist"). This, or course, drives bond prices up and distorts the normal response of bond prices to the economic outlook. On the equity side, we have high quality companies borrowing money at record low interest rates to buy back their own shares, thus driving their profits in $/share higher with fewer shares. How long can this go on?
In his own words, Bernanke’s initial plan was to quit printing money only when unemployment falls to 6.5%. That is kind of like a family in serious debt borrowing more and more money until "things get better". How is that for "chasing your tail"? At no time in the past has any nation become more fiscally sound by taking on massive additional debt.
|
|
Our Beloved Ben Bernanke (BBB) put the brakes on the bull run one month ago by (a) hinting that the economy was indeed improving, and (b) drastically reducing the criteria under which the Fed would start throttling back on the money printing (the so-called "tapering"). BBB raised the employment rate criteria for the Fed to start "tapering" from 6.5% to 7.0%. Since the employment rate is now 7.4%, his change brought the target much closer to today's unemployment rate. Hence, it did not take long for big investors to realize that they would not be able to count on QE3 well into 2014, or even to the end of 2013. So, of course, many large investors ran for the hills. Let me get this straight, improving economy equals stock market drop? To me, that is backwards from all past market performances I’ve experience.
|
Then, the following week, reports showed that whatever economic growth that we may have (if any) was slowing or reversing. In other words, Ben's Quantitative Easing is NOT working!!! On this news, the market dropped, right? Wrong again. The fat cats and big traders, who couldn't care any less about our economy, drove the market way up and started a new up-trend because extended QE looked more feasible. It seems to me that something is wrong when the economy slows and the market goes up. It’s not surprising that no one even claims to know how to invest in this environment.
.
The moral of this is that our markets most likely will not suffer a large drop as long as the Fed is printing and giving away your money, but it will be a pretty dismal outcome if they do stop in the near term.
Let's not forget that the main things moving the stock market are the plans and actions of the Fed. In my lifetime of investing, the only long-term indicator that has never failed is the one between the money supply and stock market movements. Over the years, the market has had substantial gains when the money supply was growing and big contractions when money was tight. That is when I learned to "never fight the Fed".
These days, however, with this Fed's actions, the markets are convoluted. Our only chance is to use a good timing model like MIPS that follows the trends of the big guys, because they are always right (by definition). I would also always be right if I had enough buy/selling power to take the market with me as I trade, like they do.
Sunday, July 07 2013
Our previous entry [Three Possible Market Moves (And Why)] showed 3 likely market moves from July 1st. Well, for now, it looks like #1 (moving up from here) won the several weeks battle between the bulls and the bears.
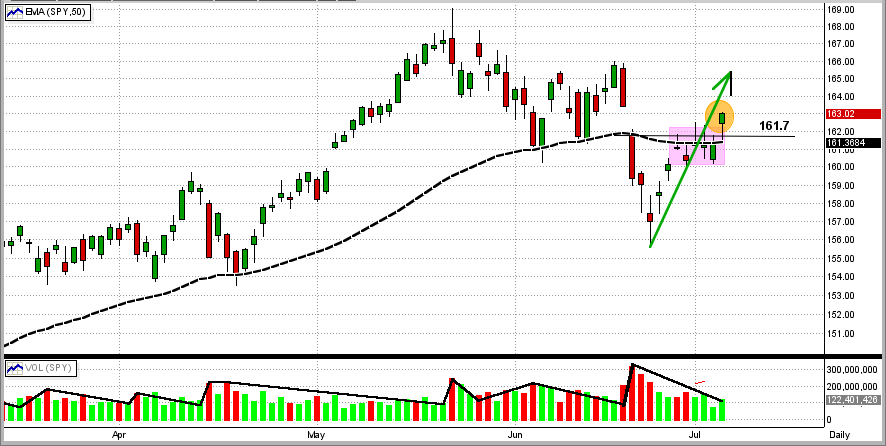
In the graph immediately below, you can see that after 5 days in a tight trading range (pink box) around the 50-day EMA (black dashed line), the SPY broke up with a gap (orange ellipse). This is enough for most market "technical traders" to say this is a huge win for the bulls. From my perspective, the only thing that I did not like about this is that this break-out happened on very low volume (little guys?). As to where this takes us in the next few weeks, we will depend upon MIPS.

Monday, July 01 2013
Let's not forget that the main things (and maybe the only things) moving the stock market are the plans and actions of the Fed. In my lifetime of investing, the only long-term indicator that has never failed is the one between the money supply and stock market movements. Over the years, the market has had substantial gains when the money supply was growing and big contractions when money was tight. That is when I learned to "never fight the Fed".
These days however, with this Fed's actions, the markets are convoluted. A couple of weeks ago, the market took a big hit when Bernanke (Ben) set some guidelines for when the Fed might start throttling back on printing money (so-called "tapering"). Printing more money, of course, means diluting our actual money, with hypothetically "more for everyone". Problem is, however, the "everyone" does not include us. Ben was emphatic that when the economy improves, the Fed will cut back on printing money (as should be). And, this drives the market down? Great.
Then, the following week, reports showed that whatever economic growth that we may have had (if any) was slowing or reversing. In other words, Ben's Quantitative Easing is NOT working!!! On this news, the market dropped, right? Wrong again. The fat cats and big traders, who couldn't care any less about our economy, drove the market way up and started a new up-trend. It seems to me that something is wrong when the economy slows and the market goes up. No wonder no one even claims to know how to invest in this environment (and by "how to invest", I am including stocks, bonds, gold, etc.)
So, here are the possibilities that we see from here:
(Note: this is not part of the MIPS program, but only my opinions of how I think the big guys and traders see the market.)
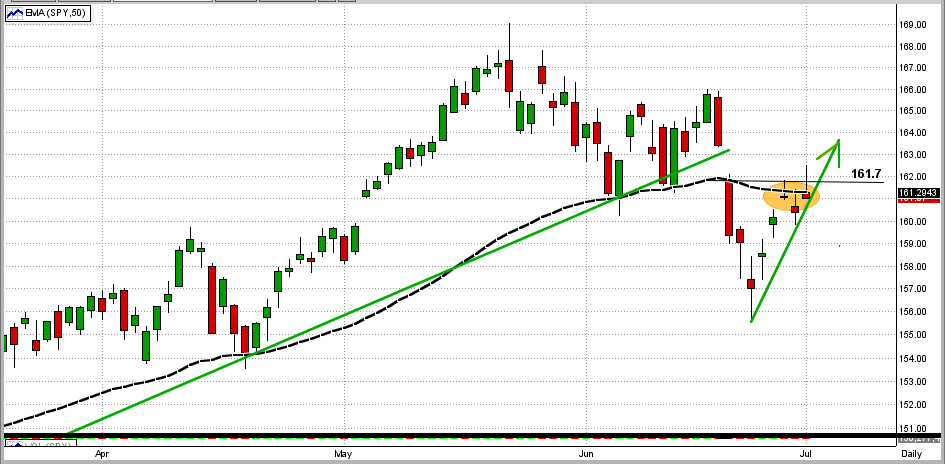
I.) Graph #1
In the graph below, we can see that (a) the market took a dive 9-10 days ago when Bernanke opened his mouth, (b) it had a "key reversal day" four days later when reports showed a slowing economy, and (c) it has made a sharp rebound since then. Now, we are at a critical juncture. The SPY has hit and failed to break its 50-day EMA (black dashed line) to the upside in the last three days and, hence, has failed to recapture lost territory above $161.7 on the SPY (orange ellipse). If the SPY does break this resistance level to the upside in the next few days, the bull should continue to run. If not, we will continue to scenarios II or III below.

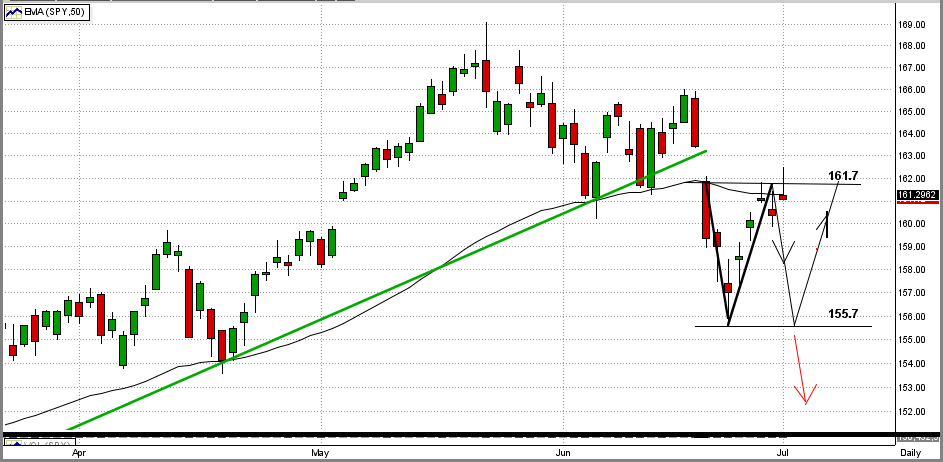
II.) Graph #2
If the SPY fails to break above its 50-day EMA and its 161.7 resistance, it will turn around and head back down. If this happens, there is a good chance that the market will trade in a sideways trading pattern as shown in black below. This is a dangerous pattern because of the high possibility of getting whipsawed.
III.) Graph #2
The other possibility if the market retracts from this 161.7 resistance level is that it will not go into a sideways trading pattern, but rather head down into a much larger correction (red arrow).

Like everyone else, we really have no bias one way or another on these possibliities. I keep saying "don't fight the Fed", but so much damage has already been done that anything is possible.
Like it or not, the fat cats will have to make a move sooner or later. MIPS will be closely watching their volume and will closely track (and duplicate) their movements. Right or wrong, the big guys move the market one way or another, and I want to be in their camp when they do.
And, we must rely on the math in MIPS' models to figure this out for us.
|