Saturday, September 28 2013
It is not really whether or not a market crash is coming, it's when. How do we know this? Because the big-bad-bear ALWAYS comes.
The very same "evidence" that Buy and Hold pundits (liars) use to prove that buy and hold works, actually proves that it does not!!! Their basic evidence is the "100 Year Dow" graph below. Upon close examination, starting with 1900-1920, you will see 20 good years followed by 20 flat/down years, over and over. BTW, being flat or "even" after 20 years is really a tremendous loss, because one would have doubled their money over 20 years with bonds paying only 3.6% !!!
From the graph below it would seem that, if people lived 100 years or more, the Buy/Hold liars may have a point. But most investors' prime "equity" investment years are from the time that they are, say, 45 years old (bought house, kids in college, career sound, etc.) until they are 65 years old (approaching retirement, need safe investments, more money in bonds, etc.) So, the prime time span for investors having a large portion of their portfolios in equities is about 20 years.
In the last 110 years, the 20-year good/bad periods were:
Good 1900-1920 1940-1960 1980-2000
Bad 1920-1940 1960-1980 2000-????
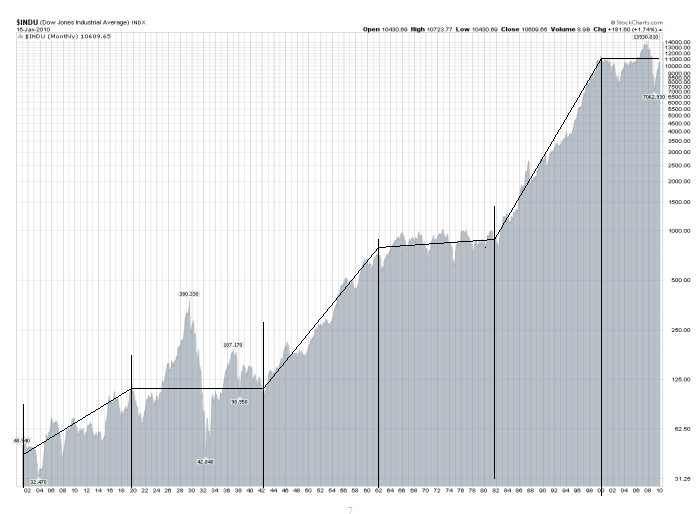
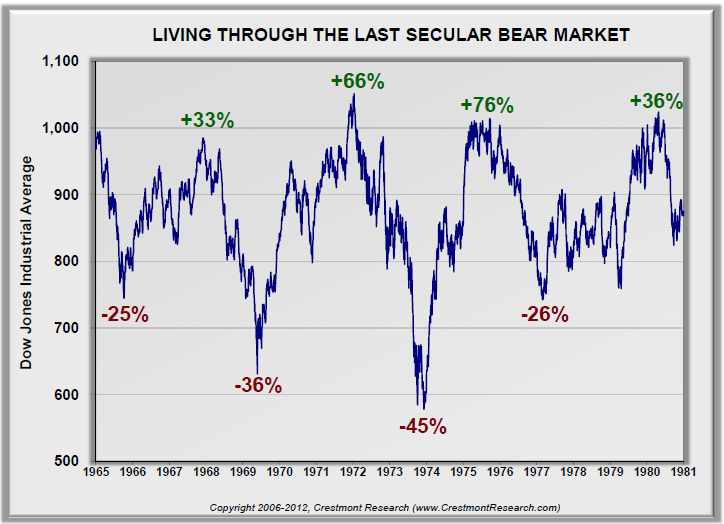
Almost everyone knows that the stock market in 1920-1940 experienced the biggest crash in the last 110 years, and we have personally "lived" through the market up/downs in 2000-2013. But, what about the market in 1960-1980? For that, see the graph below. One could say that the graph speaks for itself.
It should be obvious by now that this leaves the time period 2000-???? to dissect. Will we have another big drop? If so, when? And, how fast will the market turn down, and will MIPS catch the turn? My experience has shown the market crashes that result from bad fundamentals change slowly (long bubbles like housing, etc.), whereas, crashes that come from surprise "events" (like Lehman Bros.) change quickly.
See the graph between 2000-2013 below. We all know (unfortunately) that we have had two big market drops of over 50%. You will probably be relieved to see that, at the top, these markets traded in a range of (+ and -) 5% of their market tops for 8-9 months, before they headed down fast !!!
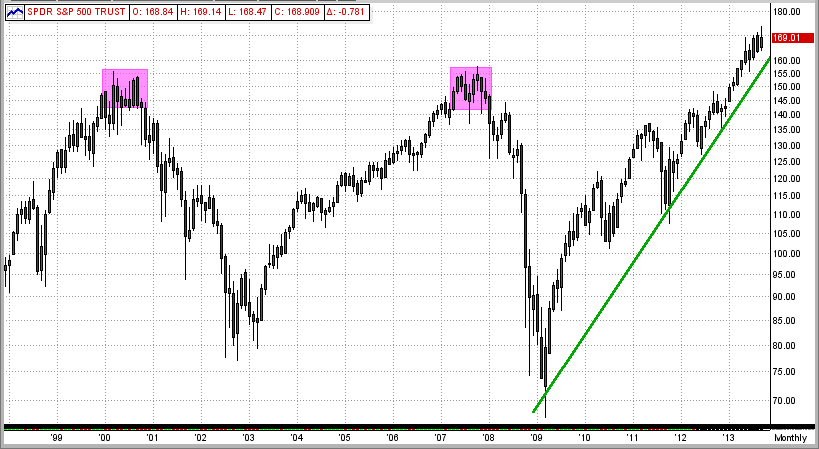
How did MIPS handle the market crash of 2008? Well, it started with a short call on 12/12/07 (+12%), followed by another short on 6/11/08 (+10), and then the mother of all shorts on 9/04/08 (+27%). What, me worry?
Saturday, September 21 2013
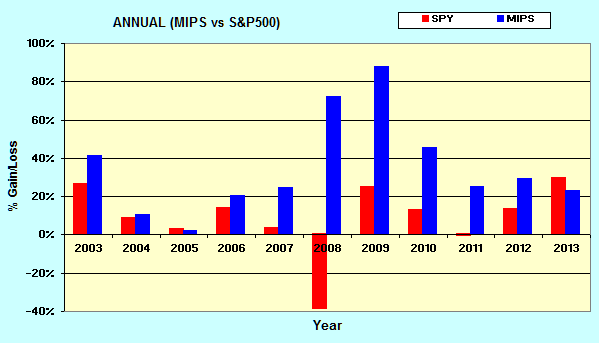
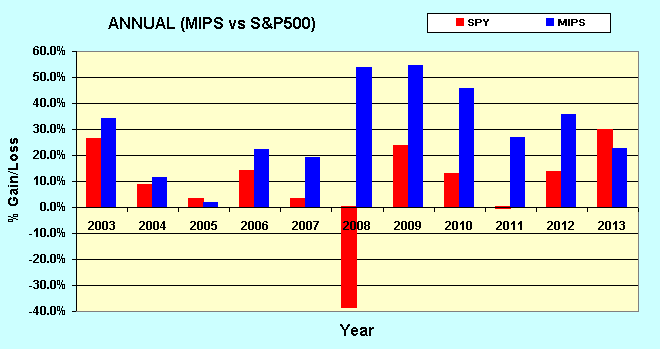
See the Annual Returns for the MIPS/Nitro model from 2003-2013 YTD below.
It is interesting to see that, in 2008, Nitro was up almost 90% when the SPY was down over 40%.
You might ask "How can that happen?"
- It happened because: (a) Nitro was not short the entire year, and
(b) the SPY did have some up periods in 2008, and Nitro was long in these up periods.
So, Nitro caught most of the up and down trends in 2008 (see Nitro signals and performance on the MIPS website).
Saturday, September 21 2013
See the Annual Returns from the MIPS4/MF+ Model for 2003-2013 YTD below:
Wednesday, September 18 2013
Our Beloved Ben did it again !!!
- when he stood up and said "No Tapering," the markets went wild immediately.
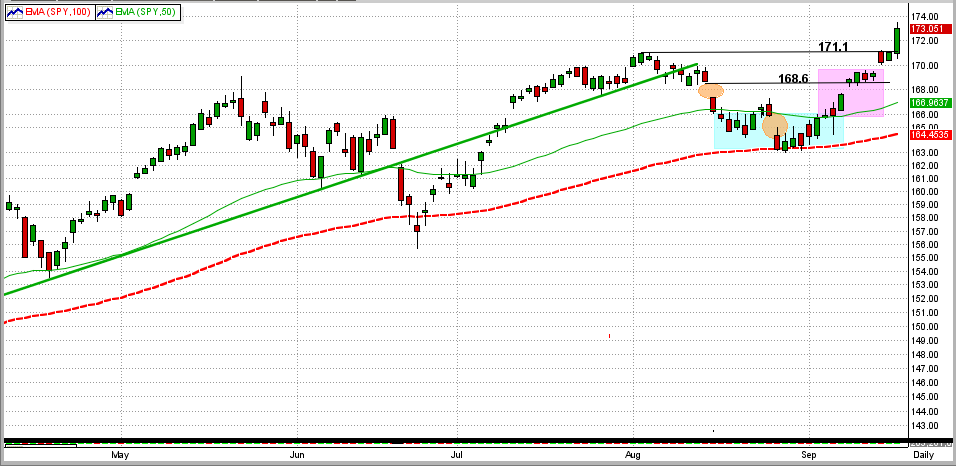
- the SPY easily broke its all-time upside resistance at $171.1 and closed at $173.05 (see the 1st graph below).
With liquidity coming from (a) Brother Ben, (b) mom-and-pop coming back in the market, (c) a mass exodus from bonds to stocks, etc., how could the markets go anywhere but up? [Bonds are such a bad investment now, we have read that even bond funds are buying stocks!]
We see more upside (and maybe even much more upside) in this bull run, but the market does not always follow my direction. Because of this, when the time comes to hold-or-fold, we rely on MIPS to tell us what to do.
More on this later...
Saturday, September 14 2013
MIPS Members:
In our previous blog from 9/9/2013, we showed the SPY's breakout from a several week, tight trading pattern. For the last several weeks, the SPY has been very volatile.
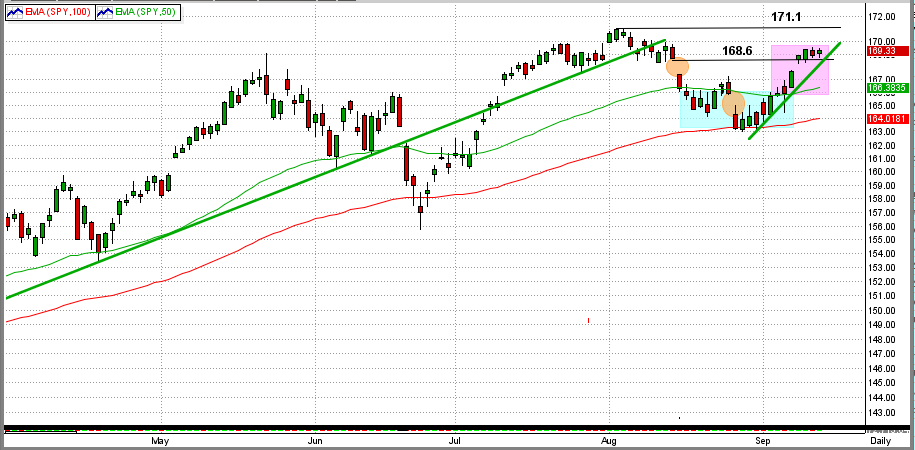
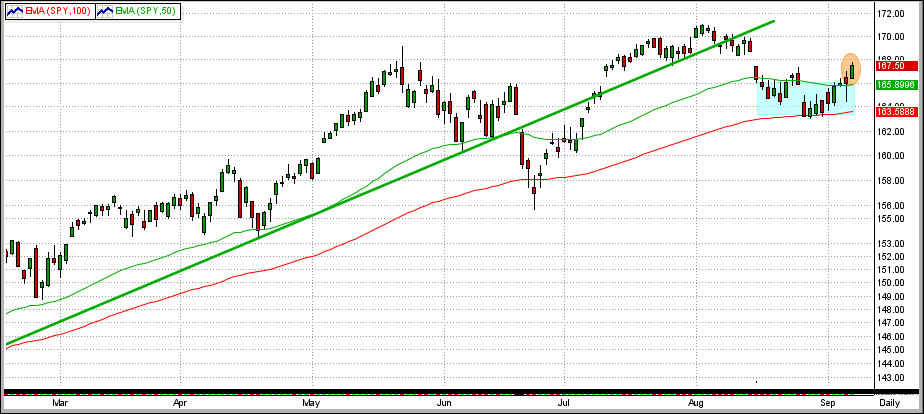
In the graph below, we can see that since 8/8/13:
1) the SPY broke its long-term trendline (top green line)
2) the SPY gapped down twice (orange circles),
3) it bounced off of the 100-day EMA and turned up (inflection point) on 8/28/13,
4) the SPY then broke above its 50-day EMA and closed both gaps,
5) it has held above both gaps (above 168.6) for 4 days now (purple rectangle).
From here, of course, the SPY could challenge (and hopefully surpass) its all-time high at 171.1 or it could fall back significantly. I'm glad that we have MIPS to detect and tell us what we should do (see the MIPS Market Strength Indicator below).
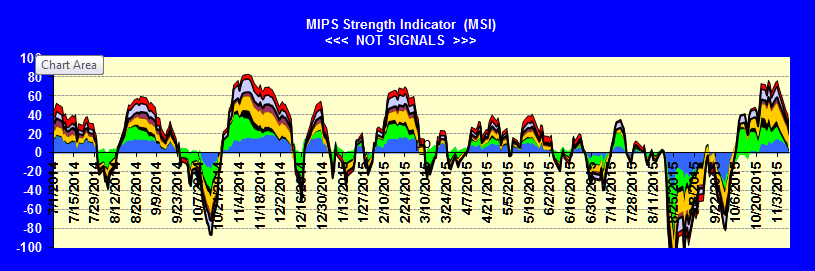
The MIPS Market Strength Indicator (MSI) has improved significantly in September. See graph below:
Monday, September 09 2013
In our previous blog from last Thursday, we showed that the SPY was ready for a breakout from its tight sideways trading range between its 50-day and 100-day EMAs. On Friday, the bulls pushed the SPY up above its 50-day EMA (and above the trading range), but the bears sold it back down to close just slightly above its 50-day EMA.
Today, however, the SPY make a nice, solid break out of the range and well above its 50-day EMA (orange ellipse). This would normally mean a run up, but we never know for sure. That's MIPS' job.
Thursday, September 05 2013
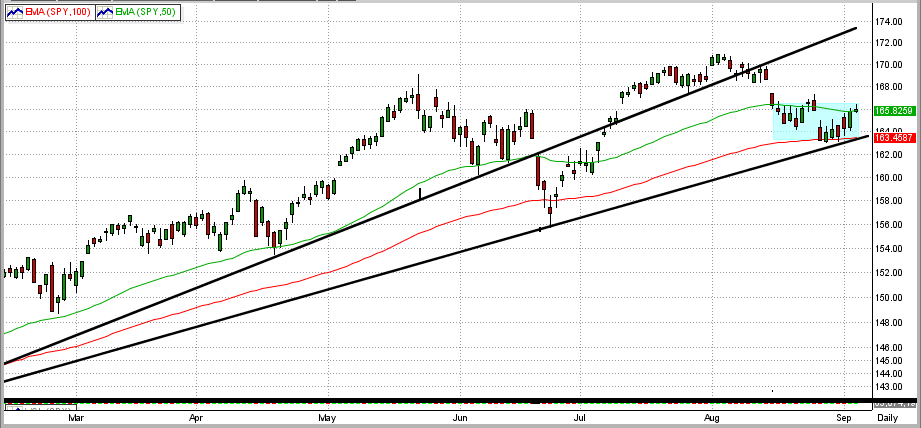
The SPY is stuck between its 50-day EMA and 100-day EMA, but not for long (see graph below):
Green Line = 50-day EMA
Red Line = 100-day EMA
Straight Black Lines = Trend Lines
Blue Box = Trading Range
In 2013, we have lived through meager gains in the economy, small setbacks, the Fed's QE3 and hints at "tapering" its purchasing of Treasury bonds, and the crisis in Syria, with the recent U.S. markets going nowhere. Sometime soon, we believe that the market will establish a new trend (up or down). It is difficult to digest all of this activity, but a technical analysis of the SPY's performance offers some insight.
The SPY broke its 6-month "primary" trend to the downside on 8/12/13.
- Then, on 8/15/13, it broke its 50-day EMA.
- In the last 3 weeks (15 trading days), the SPY has formed a trading range between the bottom of its
50-day EMA ($165.8) and the top of its 100-day EMA ($163.4).
- This is a "tight" trading range, with the top and bottom being only 0.7 of 1% around the mid-line of the trading range.
We believe that the SPY will break this range soon (up or down) and MIPS will instruct us to go long or short in due time to make money on this new trend.
Monday, August 26 2013
Crazy markets these days...
But, we all know at least two things:
1) Economic conditions are bad enough to send the US stock market through the floor, and
2) It is foolish to bet against the Fed, and if the Feb keeps printing money at a record pace, it
will be hard for the markets to fall.
It's not worth going over this again, but you can get the general idea from our previous blogs.
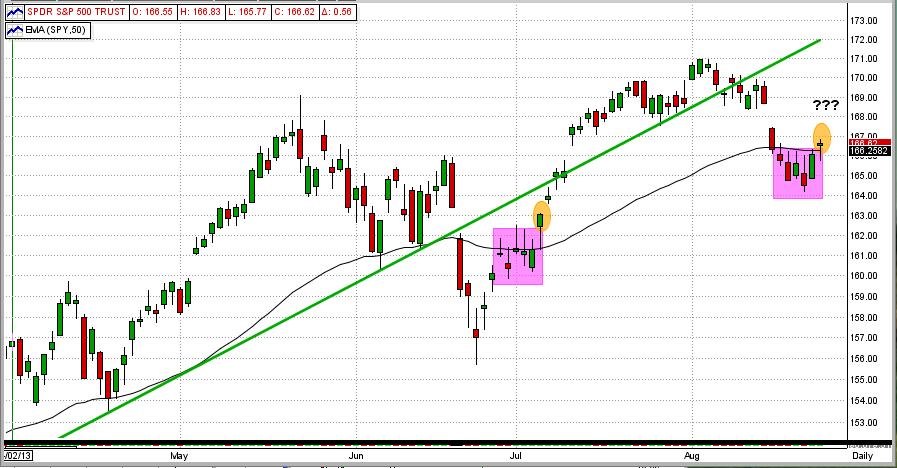
So, what do the tea leaves say now (see graph below) ???
1) In early July, the SPY recovered from a fast (but rather small) correction and then bounced off
of the bottom of its 50-day EMA for 5 days (purple box) before heading up (orange circle) and then reaching new
all-time highs.
2) After falling below its 50-day EMA for the second time a week ago, the SPY has again bounced off
its 50-day EMA for 5 days (2nd purple box); and again, it appears to have stuck its nose above the
50-day EMA (orange circle).
3) Of course, if the bulls can get a strong break-out to the upside at this point, we could see more new
highs; but if not, things could get ugly fast.
Instead of guessing, it is best for us to depend on MIPS to tell us what to do, and when.
Tuesday, August 06 2013
The following is the opinion of the author and is not a part of the MIPS models or programs.
We do not believe that this bull market is over, for the 3 simple reasons below.
1. The chart below is indicative of every bull market where the Individual Investors
(the "little guys") buy at the top. This is just starting but can go on for a long time.
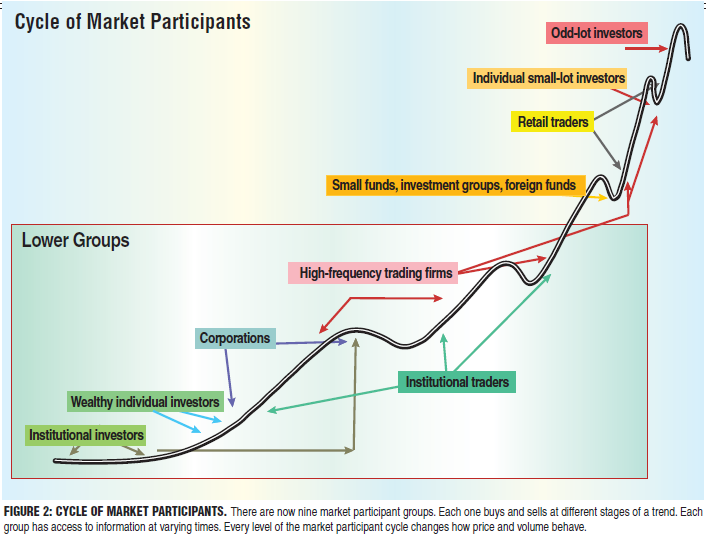
2. The little guys have not yet re-entered the market en masse, BUT THEY ARE
STARTING TO SELL BONDS AND BUY EQUITIES NOW !!!
- From CNBC - http://www.cnbc.com/id/100938142
3. Ben Bernanke is still printing money at a rapid, crazy rate (see email below)
We will depend up MIPS to tell us what to do, and when.
Sunday, July 21 2013
Our previous entry discussed Ben Bernanke's influence on the market. This entry summarizes the results.
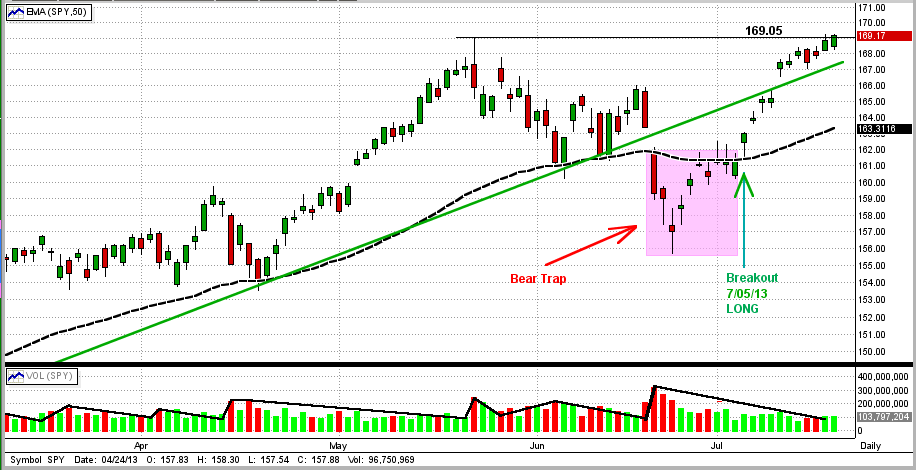
In the graph below, we can see:
1) MIPS followed a 6-month uptrend in the SPY
2) MIPS, along with other timing models, got caught in a short "Bear Trap" (pink rectangle)
3) This included a sharp drop followed by a one-day key reversal on 6/24/13 and a 6-day sideways
consolidation pattern before breaking up on 7/5/13.
So, what does this new uptrend have to do with Helicopter Ben? Read on...
|
UPDATE
It seems as though no one has a strong feeling for where this market will go from here. The market has hit all-time closing highs in the major indices and the retail investors (the "little guys") are rushing back into a market that they missed to the tune of over $100 billion per quarter. As always, a large number of issues/circumstances should determine the market's moves from here. But, is this true now?
One could make a strong case that the market behavior from here is not dependent upon the tens of thousands of institutional investors/traders or hundreds of millions of little guys, etc., but mainly on the actions of one man, Ben Bernanke, Chairman of the Federal Reserve.
Supposedly to stimulate the economy, Helicopter Ben is printing $85 billion dollars every month with no end in sight. Our national debt rose by over $1 trillion last year, and we have more debt now than all of the countries in the European Union combined. This will ultimately throw everything into chaos. At this time, the USA can afford the interest payments on our national debt ONLY because Helicopter Ben is keeping interest rates on US Treasury bonds artificially low ("Operation Twist"). This, or course, drives bond prices up and distorts the normal response of bond prices to the economic outlook. On the equity side, we have high quality companies borrowing money at record low interest rates to buy back their own shares, thus driving their profits in $/share higher with fewer shares. How long can this go on?
In his own words, Bernanke’s initial plan was to quit printing money only when unemployment falls to 6.5%. That is kind of like a family in serious debt borrowing more and more money until "things get better". How is that for "chasing your tail"? At no time in the past has any nation become more fiscally sound by taking on massive additional debt.
|
|
Our Beloved Ben Bernanke (BBB) put the brakes on the bull run one month ago by (a) hinting that the economy was indeed improving, and (b) drastically reducing the criteria under which the Fed would start throttling back on the money printing (the so-called "tapering"). BBB raised the employment rate criteria for the Fed to start "tapering" from 6.5% to 7.0%. Since the employment rate is now 7.4%, his change brought the target much closer to today's unemployment rate. Hence, it did not take long for big investors to realize that they would not be able to count on QE3 well into 2014, or even to the end of 2013. So, of course, many large investors ran for the hills. Let me get this straight, improving economy equals stock market drop? To me, that is backwards from all past market performances I’ve experience.
|
Then, the following week, reports showed that whatever economic growth that we may have (if any) was slowing or reversing. In other words, Ben's Quantitative Easing is NOT working!!! On this news, the market dropped, right? Wrong again. The fat cats and big traders, who couldn't care any less about our economy, drove the market way up and started a new up-trend because extended QE looked more feasible. It seems to me that something is wrong when the economy slows and the market goes up. It’s not surprising that no one even claims to know how to invest in this environment.
.
The moral of this is that our markets most likely will not suffer a large drop as long as the Fed is printing and giving away your money, but it will be a pretty dismal outcome if they do stop in the near term.
Let's not forget that the main things moving the stock market are the plans and actions of the Fed. In my lifetime of investing, the only long-term indicator that has never failed is the one between the money supply and stock market movements. Over the years, the market has had substantial gains when the money supply was growing and big contractions when money was tight. That is when I learned to "never fight the Fed".
These days, however, with this Fed's actions, the markets are convoluted. Our only chance is to use a good timing model like MIPS that follows the trends of the big guys, because they are always right (by definition). I would also always be right if I had enough buy/selling power to take the market with me as I trade, like they do.
|


