Sunday, July 12 2020
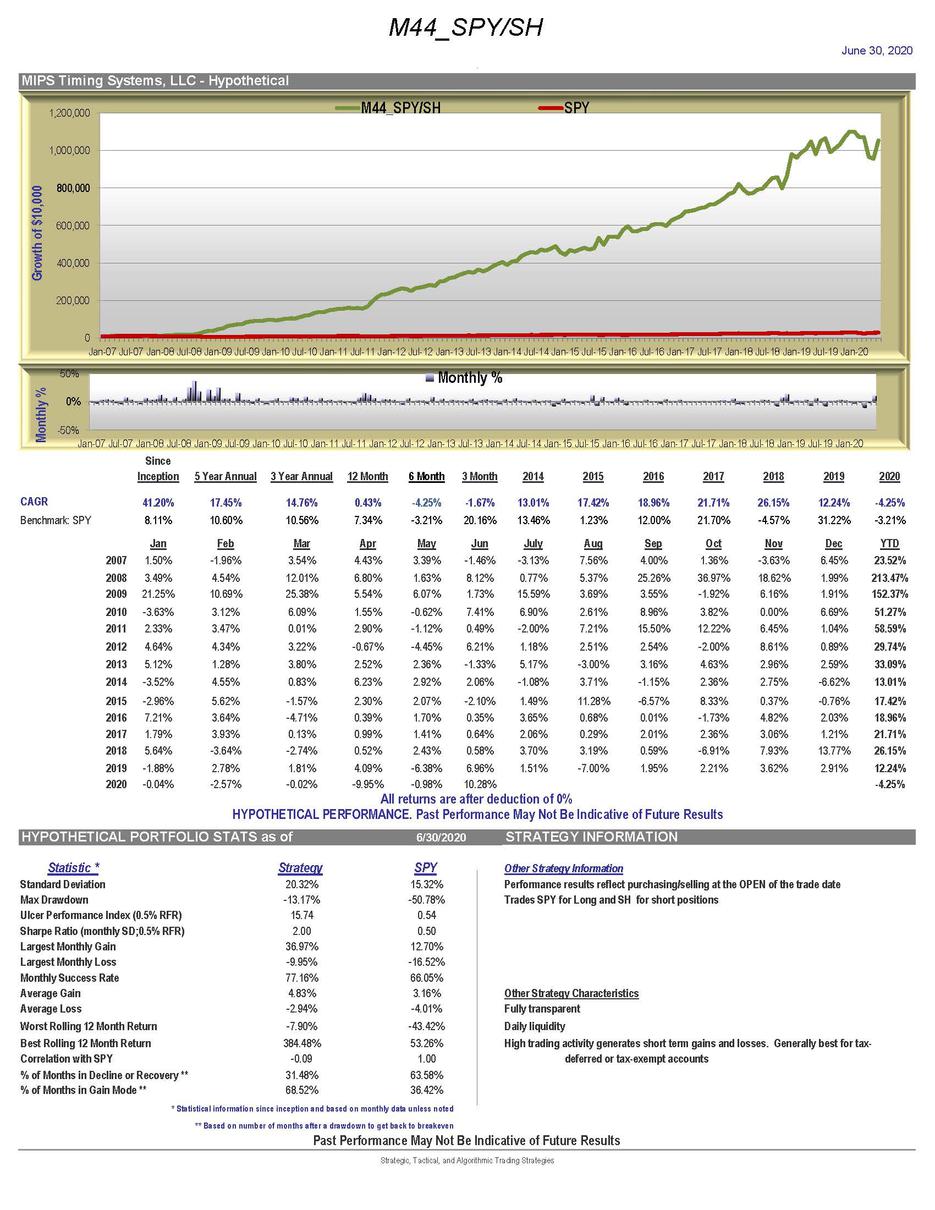
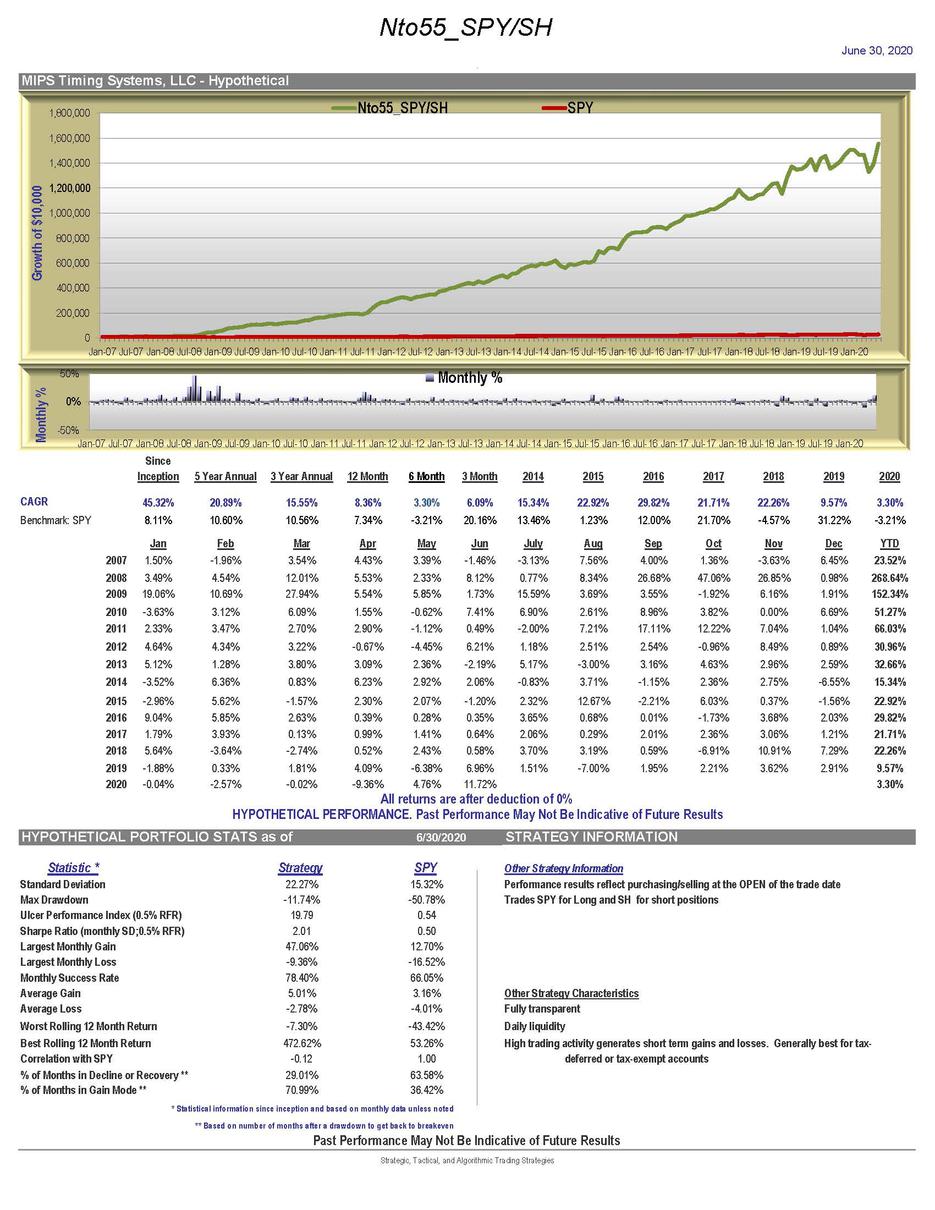
GREAT NEWS - THE NEW VERSION OF OUR MIPS MODELS HAS "GONE LIVE"
THE RESULTS ARE TERRIFIC (you will most likely not find a better model)
WE ARE BOTH HAPPY AND PROUD
See complete list of new Fact Sheets at => https://mipstiming.com/fact_sheets
All Fact Sheets start with a $10,000 Investment
Tuesday, June 23 2020
The stock market of 2020 has wreaked havoc on millions of investors. And, it has put a big dent in many retirement accounts. Most investors feel and believe that the worst is over, but is it?.
First, please understand that many market "crashes" are quickly followed by bear market rallies (aka "Sucker Rallies"). They are called Sucker Rallies because about 60-65% of the time "the rally" runs out of steam and the market turns down into a 2nd leg of the original "crash" that is even more devastating than the 1st leg down. However, professional investors have determined that in the past, if the rally recovers over 50% of the 1st leg down, in most cases the "crash" has bottomed. That appears to be what has happened now, but maybe not.
In the graph below, you can see that the market (the SP 500) bottomed out after a 34% drop (1st leg down), recovered 50% of this drop about 3 weeks later, spent 24 days trying to break above the 200-Day EMA, and since then has spent the last 5 weeks working its way to "New High" territory. If the SPY makes it to the New High territory, it will be quite a battle there between the Bulls and Bears.
The real question on my mind is "Is the market going to make it to the New High territory or tumble back down somewhere along the way"?.
Read on...
This time is different (yeah, right) because we are in the middle of a virus pandemic and the government has approved trillions of dollars in distributions to individuals and US businesses. And, even much more, the Fed has promised "no limits" in loans, buying bonds, and indirectly buying stocks. To date, the Fed has pumped trillions into the economy. This, of course, has been the main catalyst in the up moving markets (very abnormal). This cannot continue, so what's next?.
At this time, we are aware of and reading about multiple brick walls along the way up that could completely reverse this market growth into a very fast acting "free-fall' down". This includes the directions of the virus, ups-and-downs in employment, corporate financial numbers, and what the Fed does next.
Another very surprising example of what the market will soon face is nicely outlined in the following article from CNBC entitled:
"There’s a wave of selling estimated to be in the billions that’s about to hit the stock market" Click on =>
https://www.cnbc.com/2020/06/23/theres-a-wave-of-selling-estimated-to-be-in-the-billions-thats-about-to-hit-the-stock-market.html?__source=iosappshare%7Ccom.apple.UIKit.activity.Mail
Please read at least part of the above and be conservative with your money (like only investing 50-65% until this blows over).
Good News !!!
On 5/18/2020, we released our new version of all the MIPS models to accommodate:
- "fast acting markets", and
- "high volatility markets"
Our tests show that the new versions perform twice as good as the recent versions that we replaced (more later) !!!
PS - MIPS users do not have to do anything different (just follow signals from the model that you have been following).
Paul Distefano, PhD
Founder / Lead Developer
MIPS Timing Systems, LLC
Houston, TX
281-251-MIPS(6477)
408-234-8348 (my cell)
Monday, May 25 2020
This week could determine the direction for the stock market (SP500) for the next Bull or Bear "run".
Graph #1
As you can see in Graph 1 immediately below, the SPY fell like a rock in Feb/Mar 2020 (Leg#1 down), but recovered to what the "pros" say is the normal
"Retracement Point" ( https://www.investopedia.com/terms/r/retracement.asp ). These "Mr. Know It All's" claim that all bear markets tend to bounce up from their first bottom until the market has recovered about 50% of its first drop. From there, the market will decide if it will continue up or to fall back down for its 2nd drop ("Leg#2 down). BTW, most of the time in bear markets the market does just that, but these are not normal times.
So far, the market has followed the above to the tee, but it has hit two stages of uncertainty from late April until now (go to Graph #2 below)
Graph #1
Graph #2
Graph #2 below is simply an expansion of the second half of Graph #1 (to make my comments below easier to see in the graph).
The purple "flat market" or "sideways pattern" in Graph #2 shows the uncertainty around the retracement point very well. As can be seen in this purple pattern, the market bounced around in a plus/minus 2.25% range for 21 days (if that isn't uncertainly, what is it?). And, you can see that the SPY hit (but failed to break above) the SPY 200-Day EMA line 4 times (blue line).
But then, on May 18th the SPY broke out of the purple pattern AND sprung above the 200-Day EMA as shown in the smaller, brownish pattern. The market has traded in this very small range for 5 days; 4 of which closed above the 200 EMA.
So, that leaves us here on May 25th wondering what will happen next. My guess (not MIPS') is that, over the next several days, the market will break above the 200 EMA decisively and go up from here for a while. Even with that opinion, I still believe that the market will re-test its March lows before it goes back into a real bull market. . My opinions are OK, but I follow MIPS... So should you.!!!
Graph #2
Good Trading ...
Paul Distefano, PhD
CEO / Lead Developer
MIPS Timing Systems, LLC
Houston, TX
281-251-MIPS(6477)
408-234-8348 (Cell)
Sunday, May 24 2020
- In this Blog, my reference to ‘the market’ is the SP500 ETF (SPY)
This market we are in now (and have been in for the last 3 months) is one of most difficult, most dangerous markets we have seen in many decades (like all the way back to 1933).
In the last 80+ years, the SPY has ‘averaged’ gains/losses of roughly 12% per year. That results in average ‘changes’ of about 1% per month (or 0.05% per day). This 2020 market dropped 34% in 1 month and 14% in two days. And, the market changed over 8% in a single day several times in the first quarter.
See stats below for the SPY in the year 2020:
1) One Month (Feb 21- Mar 23) -34%
2) Five Days (Feb 21 – Feb 27) -15%
3) Two Days (Mar 11- Mar 12) -14%
4) One Day (Mar 16) -11%
You have to be aware that those kinds of movements are much, much faster (and larger) than any in the past; and that makes them very dangerous and very difficult to 'track'. Few (if any) trading techniques (or retail timing models), are now designed to work well in this type of market behavior. For example, some of the top performing timing models in 2020 YTD ranked by 3rd party tracking companies have terrible long-term performance records. Outside of stock markets, if a fighter jet is programmed to travel at 3,000 mph (like the USA’s F15), it would fail in combat with an enemy jet travelling at 8,000 mph (if possible). So, in all cases like this, the software would need to be updated to handle any and all new faster acting conditions.
We at MIPS are not just sitting around in this crazy market that moved faster in a small part of one month (Feb'20) than any other market has in the last several decades. MIPS is currently designed to work well in fast markets, normal markets, slow markets, and flat markets. The recent market behavior has shown us that we need to add very fast moving market conditions to our models; together with protection from large daily losses from markets with unusual high volatility .
Our development team has been working 16-18 hours daily for the last 10 weeks adding these new features to our models. I am thrilled to say that we have added several algorithms to help MIPS perform much better in very fast moving markets with unusual high volatility. The performance results from our new models are significantly better; and with a little more testing we will release the new versions of all MIPS models very soon. The graph below shows that the new version of the MIPS/Nitro model would have produced results roughly two times better than the current version.
Confidential - Below is how the new MIPS/Nitro model's performance looks now (in final testing)
Black - New Fast Moving/Highly Volatile (FM/HV) MIPS/Nitro Version of the Model
Orange - Current MIPS/Nitro Model
Paul Distefano, PhD
CEO / Lead Developer
MIPS Timing Systems, LLC
Houston, TX
281-251-MIPS(6477)
408-234-8348 (Cell)
Sunday, April 26 2020
Is the market that we are in now going to be a duplicate of 2008 and 2000 ???
- what's going to happen at the 50% Retracement Level this time ????
2008 Market Crash

2000 Market Crash

2020 Market Crash
Paul Distefano, PhD
CEO/Founder
Tuesday, April 21 2020
UPDATE
- see the last day in the chart immediately below...
- is this a "Breakout" to the downside?
- I think so, but am not quite ready to bet on it (more analysis tonight may change my mind)
- more later...
PD

Paul Distefano, PhD
Founder / Developer
MIPS Timing Systems, LLC
Houston, TX
Monday, April 20 2020
In over 80% of the MARKET CRASHES since the Great Depression, the market has started by dropping between 20-35% somewhat quickly, and then it bounced back up and recovered a certain % of the 1st leg of the drop (this is referred to as a "Sucker Rally"). History has shown that, if the rally bounces back up and "retracks" (my word) more than 50% of the initial drop, the "Crash" is over. I call this the "50% Retracement Line"
On the other hand, if the Sucker Rally fails to bounce above the 50% Retrackment Line, the market will head back down to either (a) test the previous low, or (b) drop further to between minus 45-60% from the all-time high. We are experiencing just this at this time.
As you can see in the graph below, so far this market has followed this pattern from the initial drop of about 34%; into a Sucker Rally. The Sucker Rally is now right on (or slightly below)
what we call the "50% Retracement Line". As you can see, this market drop has moved VERY FAST since it started on 02/20/2020. But, since it got real close to the 50% Retrackment Line, it has "stalled" for seven straight days (i.e., it traded in a plus/minus 2% range). Compare this to the first seven days after 2/20/2020, where the market dropped about 15% !!!
So, where do we go from here... Let's stay alert and follow MIPS signals.
CAUTION: in this crazy market, lots of things that followed some distinct patterns in the past might not even come close to doing that in this fast moving, volatile market.
SPY YTD in 2020 through April 20th.
Paul Distefano, PhD
Founder / Developer
MIPS Timing Systems, LLC
Houston, TX
Thursday, April 16 2020
We all know that the “simple” positons we can have with our stock market investments are:
1.) Long – Own equities (and bonds)
2.) Short – Own “inverse” equities (betting against the market)
3.) Cash -- Own only cash
All quantitative trading strategies have formulas and indicators that they use to determine if the market is going up or going down,
hence telling the developers whether they should be Long or Short. These formulas and indicators include:
- following the trend,
- calculating the strength of a market’s momentum,
- calculating the “rate of change” (slow or fast),
- using formulas like “Fibonacci”,
- tracking the numbers of stocks hitting new highs (and new lows),
- tracking the number of stocks that are above/below their 50-day, 100-day and 200-day moving averages,
- using the MACD formulas, and
- including literally hundreds more.
From the strength of the combination of the above (and many more), quantitative models tell investors whether to be Long or Short.
The objective is to make money in both up and down markets by being Long in up markets and Short in down markets. Good models
do just that most of the time, and their followers make money in both up and down markets.
Since we do not make money (other than a tiny amount from bank interest or money market funds) when our money is in cash,
Cash signals seem to be useless.!!!
So, where do Cash signals come from, and what does being in Cash do for us?
What Cash positions do for Investors:
Cash positions do not make money for us, BUT cash positions often prevent us from losing lots of money (as in "avoiding the crash")
Where do Cash signals come from:
To my knowledge, there are no algorithms, indicators, formulas, etc. that calculate and “issue” cash signals. In fact, many timing
models only issue Long and Short signals (no Cash). If model developers (like MIPS) want the safety of occasionally being in an
all-cash position, the developers themselves need to come up the ideas on how to determine when we should be in cash, and then
“program this” into their models.
How MIPS timing models were programed to issue Cash Signals:
Because the MIPS algorithms are proprietary, we do not explain exactly how we issue cash signals.
1.) Traditional “Stops”
MIPS goes to cash after it has lost a certain (not fixed) percentage amount from a “high point” determined
within the model; or from a certain maximum drawdown amount. Stops really mean “I don’t know why,
but you are not doing well so I am going to shut you down until further notice”. That is a Cash Signal.
2.) Too Close to Call Decision
MIPS literally uses hundreds of indicators and algorithms combined with mathematical equations to
determine the % that is Long and the % that is Short, To issue a new signal, the winning position must be
ahead by a significant amount, or the model will default into a Cash position (too close to call). For
example, if the resulting decision is 55% long and 45% short, the model may issue a Long Signal; but if
the result is 51% long and 49% short, it would almost surely issue a Cash Signal (to close to call Long or
Short).
3.) Volatility Too High
There are many different definitions of volatility (like the VIX, standard deviation, etc). The greatest
impacts on quantitative models are (a) how fast are the market changes and (b) how “large” are the changes
relative to other similar changes in the past. Recently, we experienced some of the biggest changes in the
history of the US stock markets. In March 2020, the SPY fell the fastest and lowest in one week than at
any other time since 1933 (almost 90 years ago). The daily changes in 2020 are shocking when compared to
the long-term performance of the market.
For example, it is reported that the US stock market (Dow or SP 500) has risen close to 7% per year (after
inflation) for over the last 80 years. That means that the annual percent change would have been between
9-10% per year with inflation.
To make my point, let’s use 10% gains per year. That amounts to 0.8% per month (or approx. 0.04% / day).
- In the first 5 days of March 2020, the SPY dropped over 11.5%, which is more than the 1 year average
change in the past.
- One month after 2/19/20, the SPY was down 29% (took almost 3 average years in the past to change that much).
- Between Mar 2 - Apr 15, there were 15 days with changes greater than 4%; and 4 days with greater than 9%.
In the past, where one might have lost an average of 1.5-2,5% in five bad days, one could have lost
over 25% in three bad days in 2020. With odds like that, the risk/reward ratio does not fit well for an
investor concerned about preservation of capital. In this environment, the potential losses (risk) are far
higher than possible gains (rewards). This high risk show lead to more time in cash.
4.) Market Moving too Fast
In a fast-moving market, like now, many commercial timing models are not programmed to handle fast moving
changes with such elevated daily changes. A good model would determine this and spend more time in cash.
Trading in this market environment is comparable to testing a new race car on a track that was built 20 years ago.
Let’s say that until now, there had been no “crashes’ from race cars making 180 degree turns on this track. Of course,
the embankments on these turns were designed to be quite a bit higher on the outside to prevent race cars from simply
flying off the track. Even if this track had been used successfully for the past 20 years by race cars going at 200 miles/hour;
it would not be surprising if a race car going 300 miles/hour went flying off the embankment. The reason, of course, is that
the track was not designed to handle cars going that fast. This is similar to the market we are in now. Numerous models
in use today were NOT designed for this extreme volatility. Additionally, many models are not prepared to internally make
that determination and go to CASH until after the market settles down, but MIPS is programmed to act long before then.
With respect to all of the above, MIPS has internal algorithms that address each issue. This helps investors attain good returns during
the trading day, and still sleep well at night.
Good trading…
Paul Distefano, PhD
Founder / Developer
MIPS Timing Systems
Houston, TX
Wednesday, April 15 2020
One of the most proven patterns in the stock market occurs during "Crashes".
About 80% of the time that the market (like SP 500) drops 20% or more (like Leg 1 at -34% in the graph below) and then experiences
a retracement of over 50% of the drop, that usually means that the bottom has been reached.
But, if the market stalls at the 50% retracement point level and heads back down, it will either:
(a) test the recent bottom and head back up to new highs over time, or
(b) continue the drop at a faster pace and end up dropping to up to 2 times more than the first drop (Leg 2) before it heads back up
In the graph below, you can see that we are basically "there now" (D-Day is here) !!!
- instead of guessing, let's let MIPS tell us what to do next...
Paul Distefano, PhD
Founder / Developer
MIPS Timing Systems
Houston, TX
Saturday, April 04 2020
There are many things that make the current stock market a dangerous place to be. We all know most of them, but I wanted to point out that the SP 500 Index broke below its 11-year Trend Line in early April 2020. See graph below... More later.!!!
Paul Distefano, PhD
Founder / Lead Developer
MIPS Timing Systems, LLC
Houston, TX
|


