Thursday, March 05 2020
We know that we have sent lots of emails in the last two weeks, but the short article below is a good one to read at this time.
https://seekingalpha.com/article/4329444-1918-spanish-flu-and-stocks
Paul Distefano, PhD
CEO / Founder
MIPS Timing Systems, LLC
Houston, Tx
Saturday, February 29 2020
Last week was a historic one in the stock market, with a horrific one-week drop. The drop last week was one of the top six one-week drops in the stock market since 1929.!!! And, that hurts. But still, last week's drop was NOT a stock market "crash". Remember, in street talk a "dip" is a drop less that -10%; a "correction" is a drop between -10 to -20%; and a "crash" (or bear market) is a drop of more than -20% (usually between -35% and -60%).
Furthermore, strong up-markets (bull markets) normally DO NOT just drop from all-times highs to a bear market in a matter of days or weeks. There are way too many things that go into the conditions that would turn a bull market into a bear market in a one-week period (or even in a one-month period). To see that in more detail, please look at the graph immediately below. This graph is with monthly bar-charts. As you all know, the last two bear markets happened in 2000 and 2008. What you may not know is that both times the S&P 500 market "waffled" near the top for 12-15 months in a tight, rather flat range; and they DID NOT collapse until the market broke the up trend-lines to the downside. At this time, the S&P 500 Index is way above its trendline, but that could change in s short period of time.
STOCK MARKET CRASHES SINCE YEAR 2000
THIS IS WHERE THIS BLOG GETS INTERESTING.
There is a good possibility that what is happening now in the market now is just another of the many "V-Bottom" patterns that are popular in bull markets, and you most likely would like to see how MIPS has performed when in these patterns. The graph immediately below shows V-Bottom markets in 2014, 2016, 2018-19; and the graphs following that one is how MIPS3 actually performed in each V-Bottom pattern (as verified by TimerTrac.com). As you will see in the graphs below, with V-Bottoms sometimes MIPS goes to cash, other times it stays long; and in true prolonged bear markets MIPS will be short or in cash most of the time.
See the 2008 graph below. Between 2007-09, MIPS3 was up +138% when the SPY hit its low point with a -55% loss !!! Please note that the stock market had degraded slowly for several months before the big drop hit.
 x x2014
Red - SPY
Blue - MIPS3
Paul Distefano, PhD
CEO / Founder
MIPS Timing Systems, LLC
Houston, TX
Saturday, February 29 2020
2016
Red - SPY
Blue - MIPS3
2018-19
Red - SPY
Blue - MIPS3
2008 - Between Oct 2007 and March 2009, MIPS3 was up +138% when the SPY hit its -55% low !!!
Red - SPY
Blue - MIPS3
Now, here we are 10+ years later, with a strong bull market and with still very good economic conditions; but who knows what's next. Most likely the next big moves in the market will be determined by the following "conditions":
- the COVID_19 virus,
- the inverted bond market,
- a highly over-bought stock market (high P/E ratios),
- the 2020 elections, and
- recession fears.
This is why we need MIPS to keep us out of trouble.
- if this market becomes a bear market, MIPS will make money like it did in 2008 (but most likely not that much);
and if it becomes a V-Bottom, MIPS should ride it back to where it started.
- But, of course, in either market MIPS could be whipsawed (not likely)
- MIPS3 is a very good model, but MIPS/Nitro is better !!!
Paul Distefano, PhD
CEO / Founder
MIPS Timing Systems, LLC
Houston, TX
Monday, February 24 2020
Today was the worst day in the stock market in quite a while. It is not often that the Dow drops 1,000 points and the S&P 500
drops over 100 points in one day.
Many times, large daily drops in the market result from rumors or fake news, and the negativity does not last long. But, this time,
there are two good reasons behind this big drop. One is the Coronavirus from China (and spreading) and the "inverted" interest
rate curve (i.e., where the interest rate on 3-month bonds are higher than the rates on 10-year bonds). If this virus spreads like it
could, production and trade would suffer all over the world quickly. And, if the interest rates stay inverted, the Fed could be forced
to lower rates, possibly even to zero or negative. The many awful implications of these two "reasons" are way too broad to cover
in this blog, but you can find readings about these all over the Internet.
For now, let's see how worried you should be about this drop (and future drops) at the time. First, let's see how bad today's drop
really was. Of course, a drop like today is short-term bad no matter what, but not really bad when compared to recent gains. In
mathematics this could be referred to as "relativity"; where a 3% drop in one day in a market that has grown 25-30% in the last
12 months is actually not nearly as bad as a market that has dropped 3% in one that had grown only like 6% in the last 12 months.
Graph #1 immediately show us what today's market looks like after today, and Graph #2 shows us what this looks like after
stepping back and looking at the graph from afar (like seeing a forest fire from a helicopter instead from inside the fire itself).
Graph #1
Graph #2 is the same as Graph #1, but when you step back and put it in perspective as in Graph #2, the situation does not look
as horrific as you thought (and this may keep you from panicking like an amateur).
Graph #2

Of course, the may not be the end of this mess
All of the MIPS models are still Long, but the upside support in the model is getting weaker .
DON'T Panic - This may not be the end of this mess, but we have MIPS to tell us what to do.
Paul Distefano, PhD
CEO / Founder
MIPS Timing Systems, LLC
Houston, TX
281-251-MIPS(6477)
Tuesday, January 07 2020
Note: In this article, the "market" is the ETF for the S&P 500 Index, the SPY
As we all know by now, the stock market has been almost flat since Jan'18 (but with a good up kick in 4Q'19). In many years, the market goes up in the 4th Quarter, mainly because mutual funds are selling their annual losers and replacing them with many of the hottest stocks of the year. The "rats" are doing this so that their year-end portfolios look like they had owned the "hotties" for most of the year.
As a mathematical model, MIPS was designed to basically "keep-up" with (or slightly beat) the market in up markets, and to beat the SPY dramatically (and make big bucks) in down markets. BTW, those that want to beat the SPY in up markets should consider at least a little leverage; like 1.25x leverage in the SPY on Long Signals (go long with 75% SPY and 25% SSO); but only 1.0x leverage on Short Signals (100% SH).
Given the above, here is how MIPS performed since Oct'18:
- please note that MIPS avoided the big dip in 4Q'18
- the models that performed the best in 2019 were the ones that lost the most in the 2018.
>From here, of course, the market can go anywhere. In general, unless a bull market gets greatly "overbought", it will continue up until corporate profits go south and we reach the next recession. Other than 10-15% "corrections", markets DO NOT drop when corporate profits are healthy.
Along the way, however, the market is disturbed by dramatic events (Brexit, international trade setbacks, etc.). The big Institutional Investors ("fat kats") like volatile markets because they buy at the bottoms and sell to the little guys at the tops. It is hard for us to predict the tops and bottoms, but it is very easy for the fat kats to do so because they basically "cause" them to milk the little guys.
Market Crashes
At this time it is hard to predict a market crash, as it will take a big catalyst (the Fed, Impeachment, etc.) to turn the bull. But, over time, the big crash will come. When it does, you want to be following a model that is good in market crashes and that is where MIPS is by far "the best". Below, you will see the actual MIPS3 performance in the 2008 crash (buy/sell/cash signals verified by TimerTrac.com since 11/04/2005).
MIPS - in 2008 Crash
Market Crash (4Q'07 - 1Q'09)
MIPS (blue) +108%
SPY (red) - 50%
From TimerTrac.com (red dots show trades)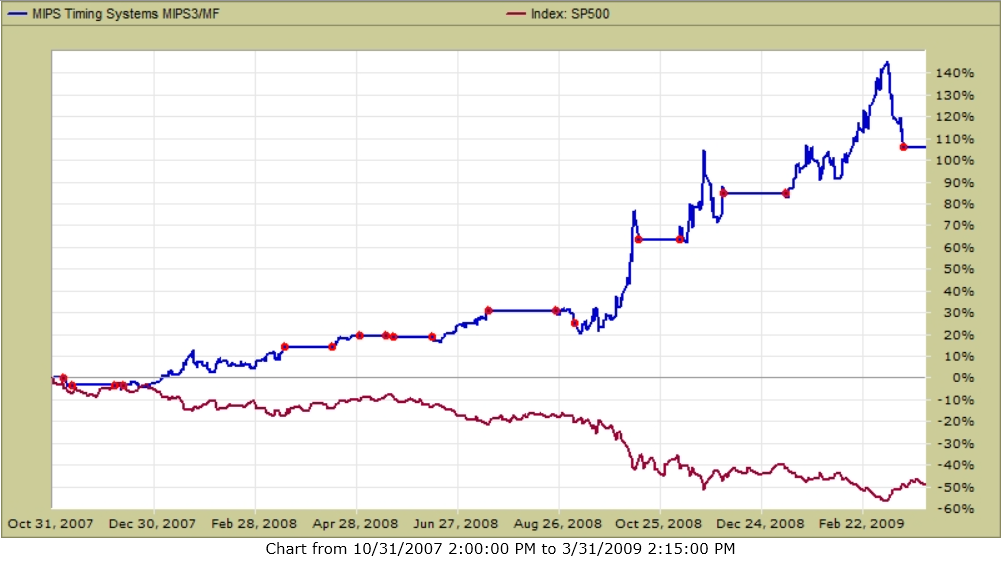
PLEASE
Do not try this yourself, follow MIPS (the top ranked model on TimerTrac.com since 2007).
Paul Distefano, PhD
MIPS Timing Systems, LLC
Houston, TX
www.mipstiming.com
281-251-MIPS(6477)
Tuesday, November 05 2019
Well, well, well... The market (S&P 500) hit another new high this week. The reason "given" for this by the press is that the economy continues to improve as indicated from the jobs report this week (showed more jobs created than expected). Of course, "the press" will release any news (or any reason behind it) that flies, if people fall for it (true or not).
See the graph immediately below and continue reading below that....
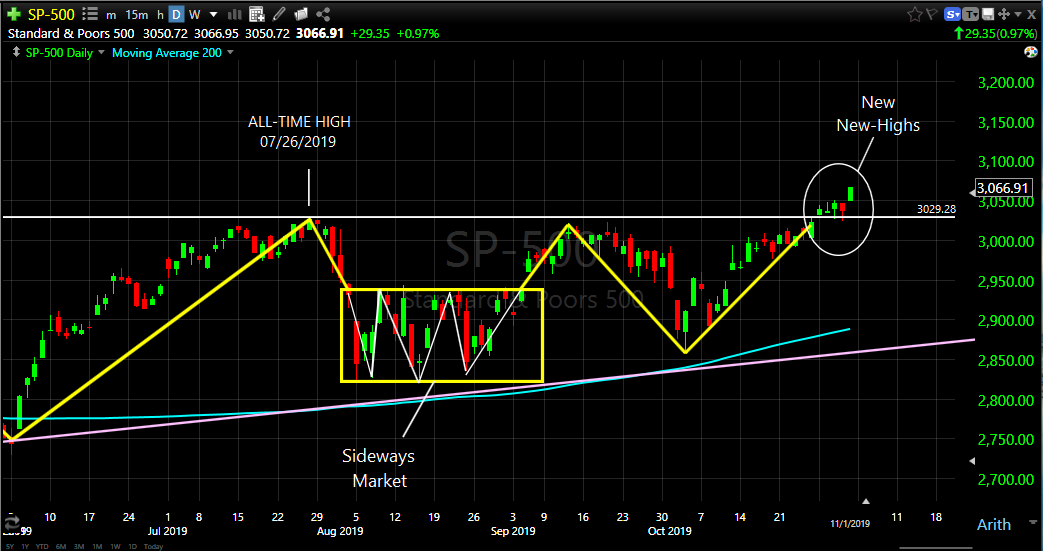
As you can see in the graph above, from a quantitative view two things are possible:
I.) A market top is showing itself in the form of a "Triple Top", or
II.) More new-highs are expected as indicated by the "upside breakout" after the 3rd try in the
last 3 months.
EXPLANATIONS
I.) The "triple top" is sometimes one of the best indicators showing a market that is getting ready to turn around and head south. It seems to me that this is not the case now, although there could be arguments regarding overbought stocks, high P/E ratios, etc. But, it is not because (as the press is pushing) the "time has come" for the market to let out steam (aka "crash").
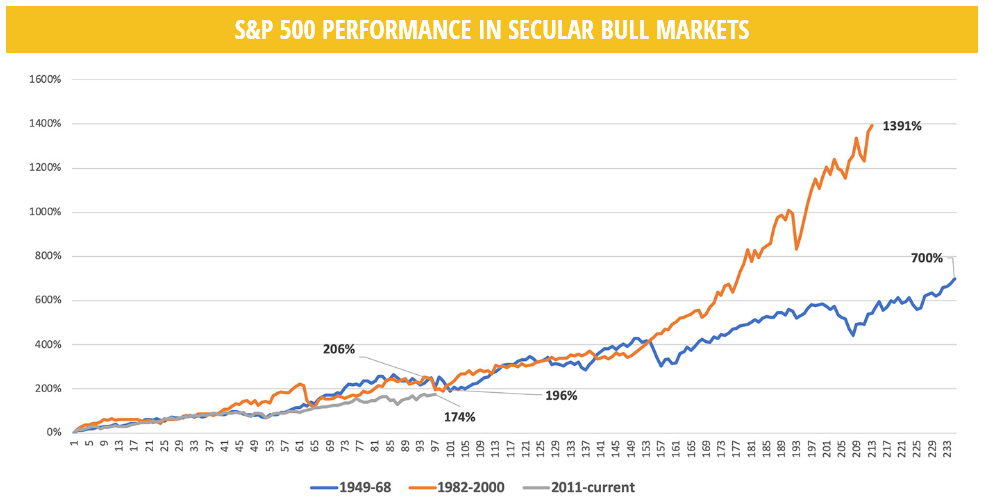
II.) Regarding the last sentence above, we do not believe that the "time has come" for the market to take a big drop. The press should look to find other reasons because there have been several other almost 20 year "runs" in the stock market since 1950, thus having lasted about TWICE as long as the "run" that we are in now. In the graph below (from Proactive Advisor magazine), you can see that "Bull Runs" have lasted 19 years in "1949-1968" (orange line) and 18 years in "1982-2000" (blue line). You can also see that after 8 years in this bull market of "2011-current" (gray line), the up-trend has been in existence for about 100 months, but it still has plenty of time to grow without having to break any "time" records.
Ok, ok... Good cases for both of the above, so "what's next"?
The "what's next" is out of my personal ability (and yours). But, I have programmed the MIPS models with sophisticated mathematics to tell us what to do, and you and I personally are not going to beat that. In fact, MIPS3 is the top model on TimerTrac.com (#1 tracking company) for performance between 2007-2019 ytd. MIPS follows the S&P 500 index (to buy or sell) kind of like the software in a F-35 fighter jet follows an enemy fighter jet (to live or die). BTW, you step into that type of arena every time you travel on a commercial aircraft (autopilot), drive a car, etc.
So, follow MIPS in the future !!!
Good trading !!!
Paul Distefano, PhD
MIPS Timing Systems, LLC
Houston, TX
281-251-MIPS(6477)
408-234-8348 (Cell)
Monday, October 28 2019
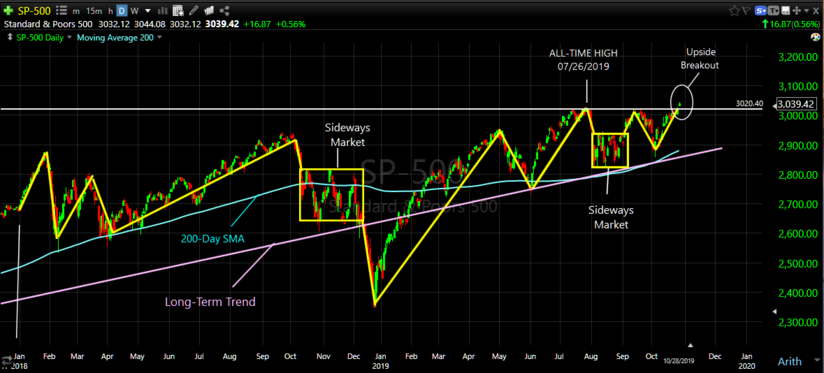
After all of the "good news" in the last two years (low unemployment, higher corporate profits, etc.), the S&P 500 ETF (SPX) made an All-Time New High today (10/28/2019). See the "Upside Breakout" on the top right in the graph below.
As you can see in the graph immediately below, the "ride" in 2018-19 has been a rocky one, with V-Bottoms, Zig-Zag, and Sideways Markets almost everywhere. It might not be obvious, but it is extremely difficult for quant models to maneuver through patterns like those below without getting whipsawed. In spite of all of this, the S&P 500 has managed a 13.6% gain so far in these last two years.
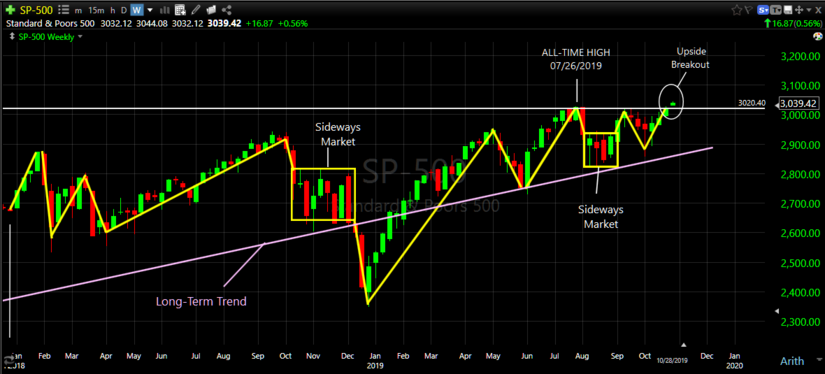
A "cleaner" way to look at the SPX over these two years is to back up and look at the same time frame with Weekly bars (below) instead of Daily bars (above). With a "higher view", the patterns become easier to see and read.
What's Next ???
The dangerous part of all Blogs regarding the stock market (or everything else for that matter) is trying to predict the future. From my view point (not MIPS') the economical part of the matter looks short-term solid (though slipping some), but the financial part (the Fed) and the political parts (tariffs, impeachment, etc.) look very shaky. Which will be in command in the next few weeks is hard to predict; but if anything goes astray on the financial or political parts, the market may drop fast and far. As far as a market "crash"? No, but very scary and potentially costly.
For help with the above, keep a constant eye on the MIPS Signals.
- BTW, all MIPS models are still Long from their 9/05/2019 signals.
Good Trading !!!
Paul Distefano, PhD
CEO / Founder
MIPS Timing Systems, LLC
281-251-MIPS(6477)
Friday, October 04 2019
It looks like the market (SPY) formed a "One Day Key Reversal" on Thursday (opened way low, closed high - see graph below):
- a Key Reversal is the point where the market trend changes direction,
- in this case, from down to up !!!
It's a good thing that MIPS remained Long (and did not get "fooled" into going Short)
Support@mipstiming.com

Paul Distefano, PhD
CEO / Founder
MIPS Timing Systems, LLC
Houston
281-251-MIPS(6477)
www.mipstiming.com
Sunday, September 29 2019
This Blog is like a continuation of the Blog that we sent out almost two months ago (see below). The reason that we are adding this new material to the previous one is to show that the current market is still waffling and nothing significant has really changed (same old, same old) in spite of what the "news" says is happening. "The press" prints what sells, truth or not. So, as you will see below, this market has been "flat" or "sideways" for almost two years now.
As you may or may not know, "sideways" markets are markets of uncertainty and/or fear (that is why they are called "consolidation patterns"). When some bad news comes out (truth or not), traders run for the hills. Then, when the bad news does not materialize, the same sellers come back buying and basically reverse their actions and fears. The main reason why most "dips" are "V-Shaped" is that the same traders that sold on the way down bought back in almost the same fashion as they sold (that is, same prices and dollar amounts).
All of the reasons from the previous email (seven of them) are still the main concerns for investors; but in reality, none may actually materialize soon. In markets like this, little guys (like us) could suffer massive losses in markets going nowhere by getting whipsawed !!!
My personal opinion is that, without any REAL massive screw-ups (as in overdone tariffs by Trump/China or stupid unnecessary rate changes by the Fed, etc) this market will break out to the upside for at least the next six months, mainly because the US economy is still strong. I can't remember a single "market crash" when corporate earinngs were high. Of course, we do not follow what I think, we follow MIPS. Stay tuned...
Here are the latest "Flat Markets" Graphs ...
3rd Quarter of 2019 (SPY)
- see the last 4 failed attempts to break the Support Level to the downside

Last Six Months (S&P 500)
- plus/minus 3.5% trading range

Long-Term View
- all the way back to 1993
- are we now in a "topping" pattern, as in 2000 and 2008 ???

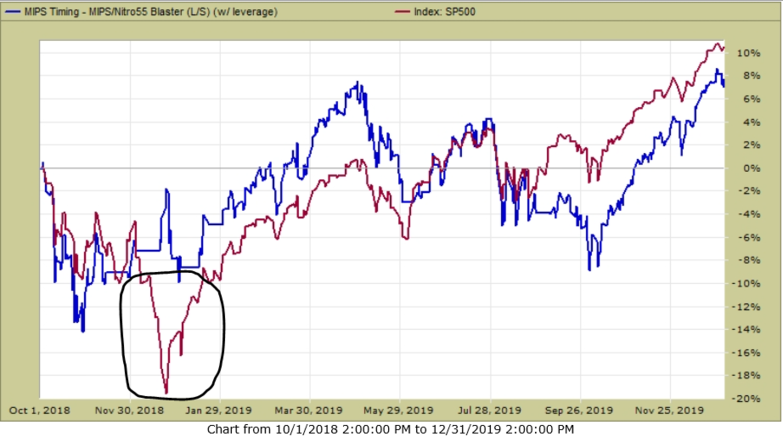
Performance - MIPS/Nitro vs SP500
- Last 12 months (MIPS is blue, SPY is red)
Results are about the same (both flat), but MIPS provided a "smoother ride" (thus helping us with our health)
Please notice that when the SPY took the big dip in 4Q'18 (-20%), MIPS was up +2% (as it most likely will be on the next "big crash"). This is what MIPS members are counting on by using MIPS.!!!

Good Trading...
Paul Distefano, PhD
CEO / Founder
MIPS Timing Systems. LLC
Houston, TX
Thursday, September 12 2019
Well. today we got very close to an All-Time High with SPY (the SP 500 Index ETF).
The first graph below is a graph of the last few months with daily bars; and you can see that the SPY hit its All-Time High today, but bounced back a little (like hitting a Brick Wall).
However, the second graph with minute-by-minute bars today (9/12/19) is more telling in that it shows that the SPY hit or came very close to the All-TIme High four times, but bounced back on each and ended down.
This is a true representation of what "Resistance" means. Many believe that when a market approaches its All Times Highs from below there are millions of investors (not necessarily traders) that lived through the existing All-Time High when it happened and are very sore that they did not sell back then. Many of these swore to themselves that if or when the market hits that All-Time High again, they are going to sell. For sure, it is highly possible that there are millions more sellers than there are buyers at many All-Time High levels.
On the other hand, in up markets with strong fundamentals (high earnings, low unemployment, etc) there could be millions of buyers waiting for confirmation that the market is still an "up market". Nothing proves this more than the market breaking its All-Time High on the up side.
So, sit back and do what MIPS tells you to do (all MIPS models are Long now).
Daily Bars

Minute-by-Minute Bars
- the muted black background space on the right is "after hours"

Paul Distefano, PhD
CEO / Founder
MIPS Timing Systems, LLC
Houston, TX
281-251-MIPS(6477)
www.mipstiming.com
|


