Sunday, September 23 2018
This is simply an update to the performance graph below (thru 8/9/18 then).
No matter what the "financial press" publishes, they do so based on what the "big guys" are saying, and the big guys are saying what they want to say in order to squeeze more money out of the "little guys". For example, if the "fat kat" top execs at Goldman Sachs (GS) were strongly convinced that the market was in for a big drop, do you think they would publish it before GS had already sold off every single bit of whatever they planned to dump? If you think they will be honest in their guidance to the press, please call me immediately because I have a great deal for you on some oceanfront property in Phoenix.
The fact is that "the market" (DOW, SP500, QQQ, IWM, etc) is pointed up with great fundamentals and should continue moving in that direction. Since 2016 this market has gone almost straight up with no need to trade. All you had to do was to follow MIPS up +55% with very few trades. And, when the trend changes, so will MIPS!!!
Of course, the risks now are that: (1) the market could get way overbought and drop back significantly, (2) the tariffs that the US is slapping on other other countries could turn negative and they could fight back with more vigor, (3) North Korea is still making noise, and could go over the edge, etc.
So, what is an investor to do?
- that's easy, let MIPS tell you what to do.
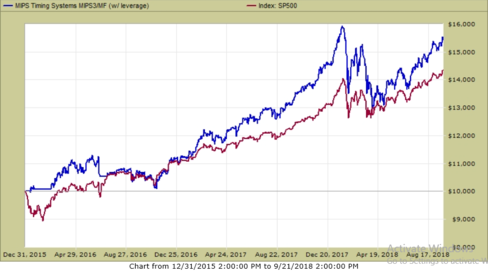
See the MIPS3 performance in the graph below.
MIPS3 from 2016-2018 YTD (+55%)
Leverage: 1.5x Long and 0.5x Short
Good Trading...
G. Paul Distefano, PhD
CEO / Founder
MIPS Timing Systems, LLC
Houston, TX
408-281-MIPS(6477)
www.mipstiming.com
===========================================================
<<< Prior Blag >>>
MIPS Members:
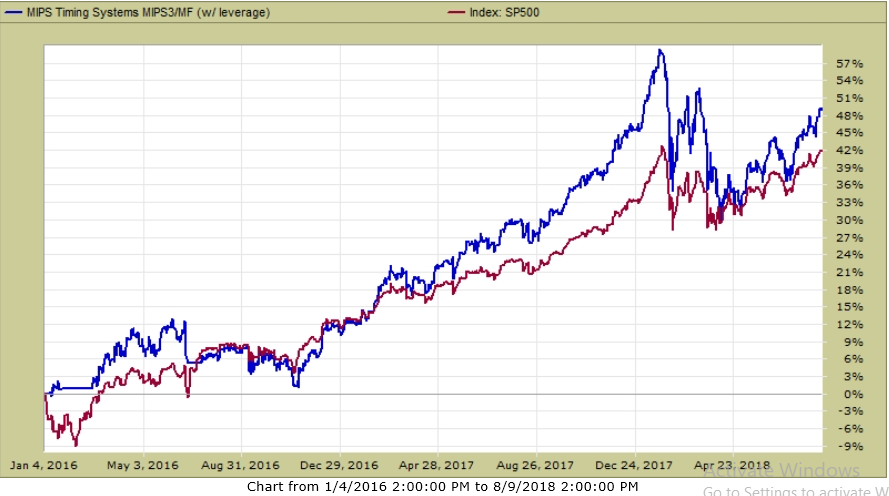
Just a short note to recap MIPS' performance since 2016.
- during that time, we have enjoyed a nice 50% gain in our portfolio.
Even though we know that the current bull market can turn south at any time, we believe that it will continue up at a slow pace until "something bad" happens. The "catalyst" for that could be things like the Fed's reaction to higher interest rates, taffifs going wild, the market getting "way" overbought, US politics getting out-of-hand (as they are headed now), etc. And, we also know that the risk is even higher now because this time we have much less to "fight with" (quantitative easing, etc.) compared to other recent market drops.
MIPS from 2016-2018 YTD (+50%)
Leverage: 1.5x Long and 0.5x Short
Don't go this alone with your hard earned money. Watch for signals from MIPS....
Paul Distefano, PhD
CEO / Founder
MIPS Timing Systems, LLC
Houston, TX
281-251-MIPS(6477)
Sunday, August 26 2018
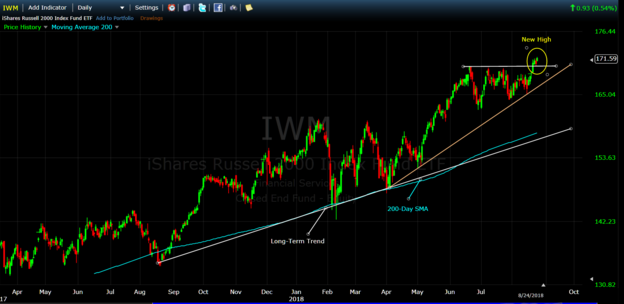
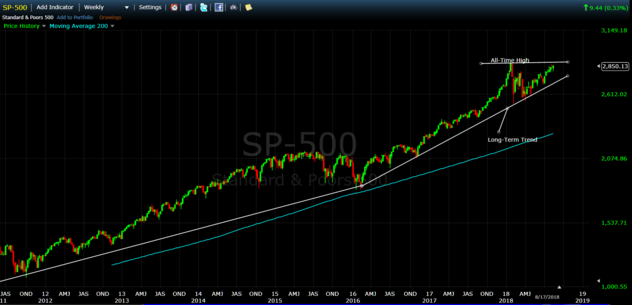
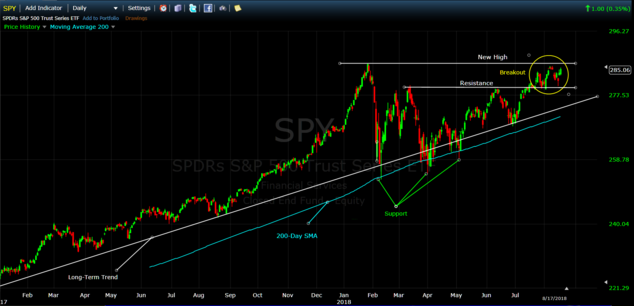
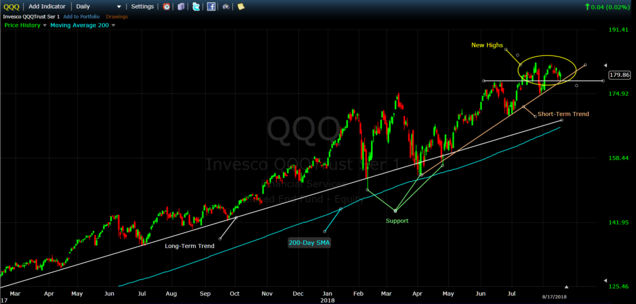
If you are following the market closely, you know that the S&P 500, the Nasdaq 100, and the Russell 2000 Indices have all hit new "All-Time Highs" last week (and the Dow is close).
Remember, rising earnings result in rising stock market prices (almost always), and geopolitical "news", etc, etc, etc, and other "junk" usually results simply in "interruptions". All of our MIPS models strive to avoid trading these "interruptions", mainly to prevent getting whipsawed.
The latest version of the MIPS models ("Blaster Series" in 1Q'16) has multiple new algorithms that have improved this to a great degree. For example, with "relativity" built in to the models, a 5-7% drop in a market that is up 20-24% over the last 12-15 months is not nearly as damaging as a drop of 3-4% in a market that is up only 6-8% over its last 9-15 months.
So, now the bull run is STILL gaining strength (see graphs below). Of course, at the heights that we are at now, a "reversal" could come at any time, sometimes seemingly for no reason at all.
That is why we need a comprehensive quantitative model like MIPS that looks at and calculates changes in the market trend 1,000 times faster and better than we can. Stay tuned...
SPY
QQQ
IWM
Paul Distefano, PhD
CEO / Founder
MIPS Timing Systems, LLC
Houston, TX
281-251-MIPS(6477)
Monday, August 20 2018
Members are familiar with the MIPS models having an up-bias since the Presidential elections ("Long" signals over 99% of the time) . We have been in a strong up-market since then (except for the turmoil in 1Q'18), so this MIPS behavior should be expected. During this time, lots of other models have suffered from way too much trading (for no reason known to me).
So, from the MIPS viewpoint, what do "things" look like now ?
Since MIPS is basically a trend following model, it is up strong. But if the strong uptrend continues, our reversion-to-the-mean algos could kick in and reverse the MIPS up-bias. Or, the market itself could collapse. None of us really knows what the market will do from here, nor do we know how MIPS will respond.
So, all we can really do is to wait for MIPS to tell us what to do. Don't miss it, as it could be a biggie either up or down.
S&P 500 Index Long-Term Trend (since 2012)
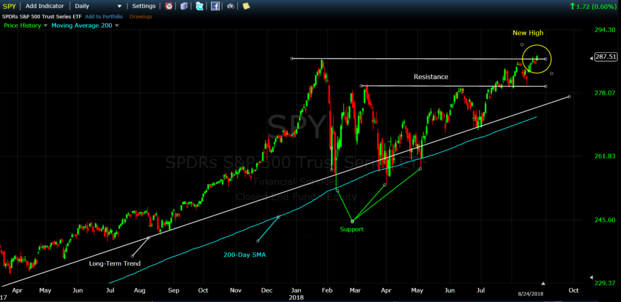
SPY Near All-Time High
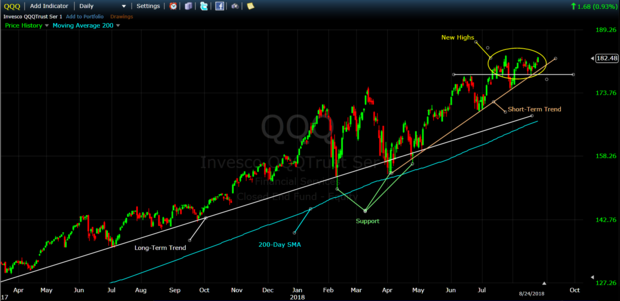
QQQ Over All-Time Highs
Paul Distefano, PhD
CEO / Founder
MIPS Timing Systems, LLC
Houston, TX
281-251-MIPS(6477)
www.mipstiming.com
Wednesday, July 25 2018
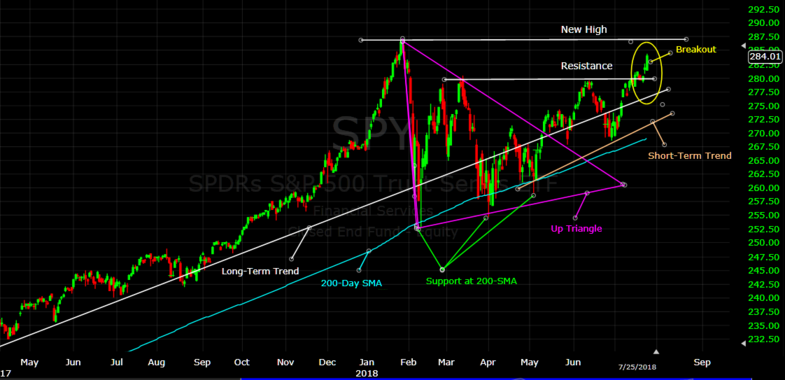
In our previous Blog (shown below), we pointed out that this market could be getting way "over-bought", but we pointed out that our economics are very good now and that usually leads to "new highs". Since then, corporate profits have continued to grow (strongly), Trump's tariffs and associated deals seem to be getting acceptance in the EU, etc. In other words, many important "things" seem to be doing well. SEE PROOF BELOW.
SPY - Breakout above Resistance
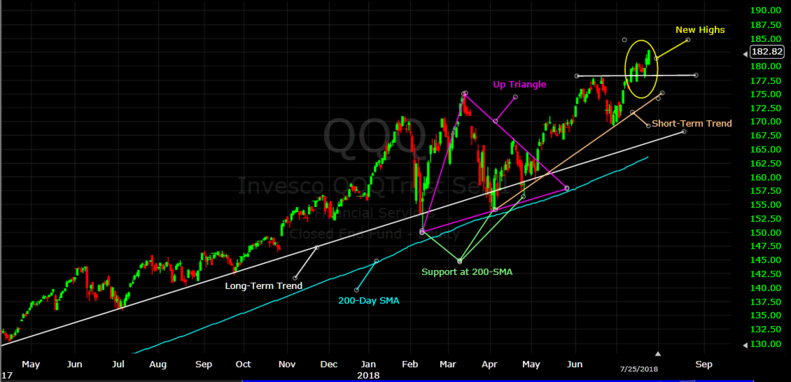
QQQ - New Highs
The danger, of course, is that if any one of the major issues at stake worldwide today (N. Korea, China's retaliating tariffs, Europe rejecting our newest tariffs without a counter-deal, a breakdown in profit growth (especially from hi-flyers, like the FAANNG stocks), could be devestating.
For Example
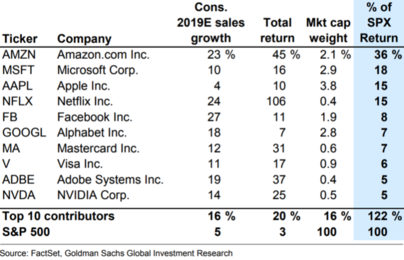
See the participation of FAANNG stocks in the SP500 Index (Facebook, Apple, Amazon, Netflix, Nivida, Google).
Market statistics show that 122% of the 2nd quarter gains in the S&P 500 Index resulted from the performance of just ten stocks, eight of which are from the technology sector. The blue column on the right below shows what % of the SP500 gain each individual stock accounted for (e.g., AMZN's growth accounted for 36% of the S&P 500 growth).
So, without any major set-backs from any of the issues above, all US indices should continue to grow with good strength; but even a slight setback could derail this extended bull market.
The "derail" part is where MIPS comes in and will tell us if any "upset" that happens is strong enough to change the direction of this extended bull market, or just strong enough to result in another rather small setback. Stay tuned...
Be careful, and feel free to call anytime between 10am-10pm CDT (six days/week).
Paul Distefano, PhD
CEO / Founder
MIPS Timing Systems, LLC
Houston, TX
281-251-MIPS(6477)
support@mipstiming.com
================================================================================
<<< Previous MIPS Blog >>>
MIPS Members:
There are a lot of things going on now that could be a "catalyst" for a big market crash or correction (tariffs. Brexit, worldwide geopolitical unrest, 2018 mid-year elections, inflation, overbought stocks, etc.). On the bullish side, US companies are stiil experiencing growing gains in corporate profits, high employment numbers, etc.).
Overall, however, some very knowledgeable financial experts think that a big market drop is inevitable soon.
- For example, read the following two of very many articles that are being posted at an alarming
rate now:
https://www.marketwatch.com/story/the-stock-market-is-days-away-from-setting-a-bearish-record-2018-06-28?siteid=yhoof2&yptr=yahoo
http://www.businessinsider.com/jim-rogers-worst-crash-lifetime-coming-2017-6
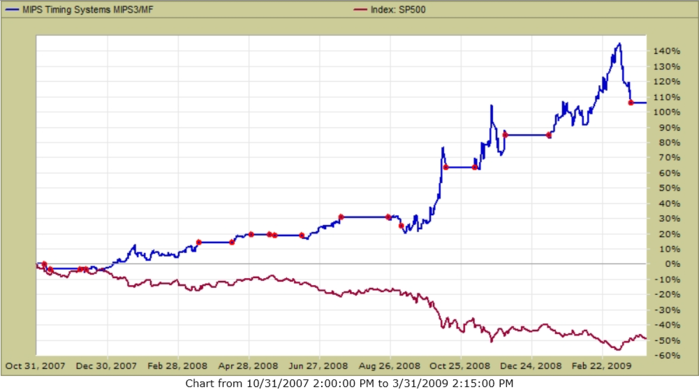
Also, at least look at the following graph. This is why many investors believe that the stock market is grossly "overbought" after its recovery in March, 2009.
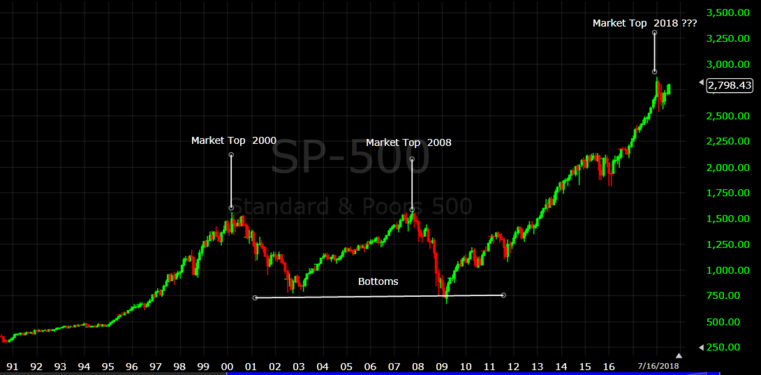
We have to at least admit that this is a scary period.
But, we are not alone. We have MIPS to tell us what to do, and MIPS reacts well in down markets.
See the MIPS actual trades and performance in the period of the "2008 Crash" (Dec'07 - Mar'09):
Be careful, and feel free to call anytime between 10am-10pm CDT (six days/week).
Paul Distefano, PhD
CEO / Founder
MIPS Timing Systems, LLC
Houston, TX
support@mipstiming.com
Monday, July 16 2018
There are a lot of things going on now that could be a "catalyst" for a big market crash or correction (tariffs. Brexit, worldwide geopolitical unrest, 2018 mid-year elections, inflation, overbought stocks, etc.). On the bullish side, US companies are stiil experiencing growing gains in corporate profits, high employment numbers, etc.).
Overall, however, some very knowledgeable financial experts think that a big market drop is inevitable soon.
- For example, read the following two of very many articles that are being posted at an alarming
rate now:
https://www.marketwatch.com/story/the-stock-market-is-days-away-from-setting-a-bearish-record-2018-06-28?siteid=yhoof2&yptr=yahoo
http://www.businessinsider.com/jim-rogers-worst-crash-lifetime-coming-2017-6
Also, at least look at the following graph. This is why many investors believe that the stock market is grossly "overbought" after its recovery in March, 2009.
We have to at least admit that this is a scary period.
But, we are not alone. We have MIPS to tell us what to do, and MIPS reacts well in down markets.
See the MIPS actual trades and performance in the period of the "2008 Crash" (Dec'07 - Mar'09):
Be careful, and feel free to call anytime between 10am-10pm CDT (six days/week).
Paul Distefano, PhD
CEO / Founder
MIPS Timing Systems, LLC
Houston, TX
support@mipstiming.com
Sunday, July 08 2018
It looks like the Bulls are still hanging in after the big drops in February of this year. Technically, the trend is still pointing UP (thanks to the technology sector).
Like always, there are issues on both sides of the stock market.
In summary:
1) On the positive side we have higher profits, lower unemployment, slight increase in wages, etc.
2) On the negative side, we have the potential of serious trade wars with China, Germany, Mexico, and
Canada; serious political issues here at home and with North Korea, tightening monetary policy, etc.
My broad opinion is that, if we can avoid a nuclear war with North Korea or an all-out civil war here, the positive economic fundamentals will override all else, and the market will continue up for at least the rest of 2018.
To my knowledge, we have never had a serious market “Crash” (drops of 40-60%) when our economy is experiencing higher corporate earnings and high dividends. [However, many times the market will turn south when profits are still high because the fat-kats at large banks and financial institutions start selling when they get wind of falling profits long before we know (and believe me they have plenty ways of doing so long before we do.)]
THE MARKET IN 2Q’18+
In order to better understand the market performance in the first week after 2Q/18, let’s compare the 1st quarter graph to the 2nd quarter one (see graphs below).
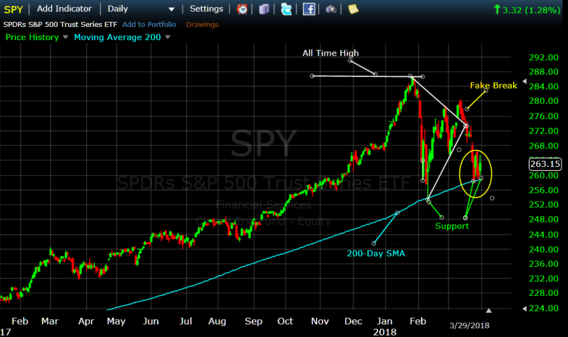
The first graph immediately below shows both of the big dips in 1Q’18, and support holding at the SPY’s 200-SMA. Of course, this was a crucial point for the market, as it could have gone either way from there.
SPY in 1Q’18
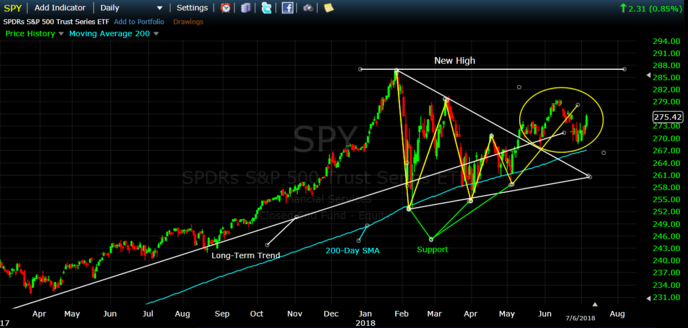
Moving on to one week after 2Q’18, it is obvious from the 2Q’18 graph below that the SPY bounced up off of its “strong” support level (200 SMA) three times and crossed above the upper line of the triangle pattern.
SPY in 2Q’18
Market Driven by NASDAQ stocks
Market statistics show that over 100% of the 2nd quarter gains in the S&P 500 Index were from just ten stocks in the SPY, eight of which are from the technology sector (like the FAANNG stocks). The blue column on the right shows what % of the SPY gain the individual storks accounted for.

The performance in the QQQ emphasizes this behavior. Please note that the QQQ moved above its Jan'18 high.
QQQ in 2Q’18
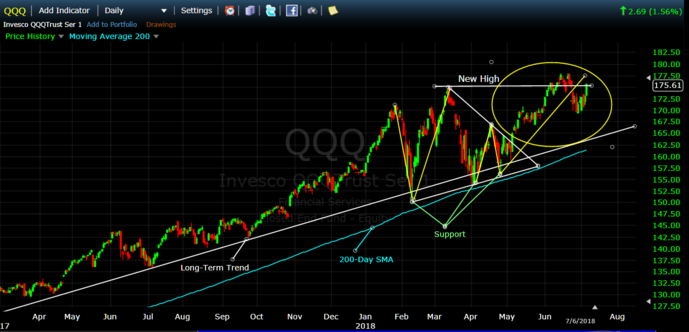
From the above, one can see that the QQQ is heading back up toward it’s all time high for a second time in three months and with high momentum.
=============================
We believe that both the S&P 500 and the NASDAQ will continue up above their resistance levels and move into New High territory this quarter. But, remember, we are all going to follow recommendations from MIPS, not me.
Good Trading…
Paul Distefano, PhD
CEO / Founder
MIPS Timing Systems, LLC
Houston, TX
www.mipstiming.com
281-251-MIPS(6477)
Wednesday, June 13 2018
In a recent email we asked our MIPS members (and followers) for their opinions regarding the direction of
the SPY from 4/23/18 through 5/31/18.
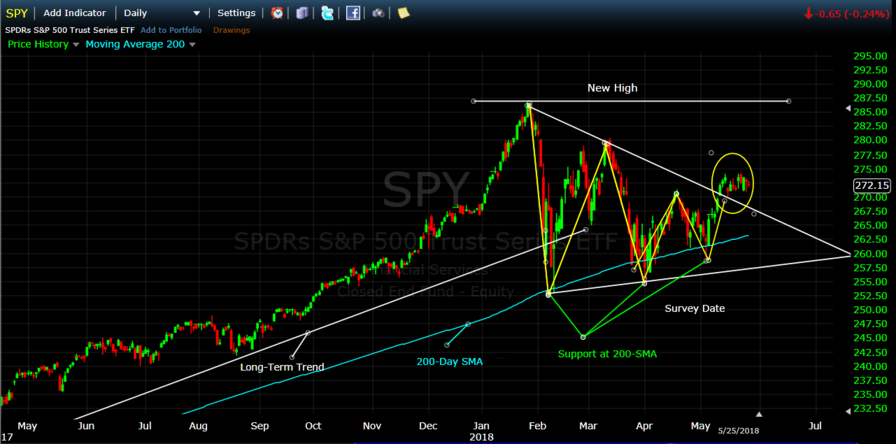
The four Categories (explained and illustrated below) were that the SPY woold:
A) complete the W-Pattern and make new highs, or
B) at or near the new high level, turn around and head back down, or
C) hit the top of the Triangle line, turn around and head back down, or
D) stall before reaching the top of the Triangle pattern, and head back down.
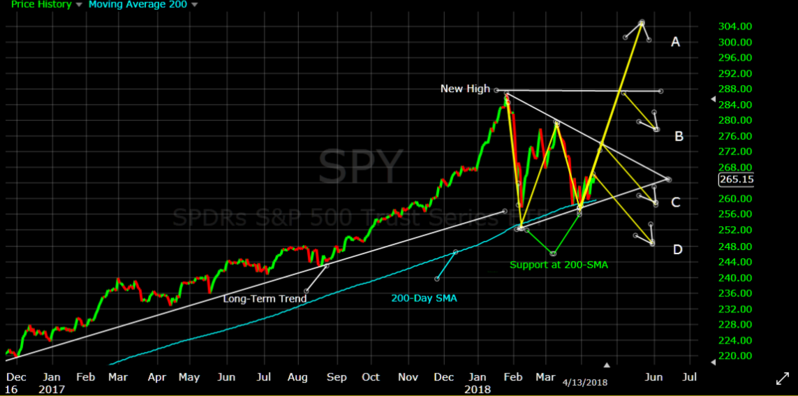
After stretching the rules a little, Category C turned out to be the winner (the SPY went up a little past the top
line in the triangle, and dropped back a little). We will be sending a one month refund (or a one month free trail)
to the first 10 members (or followers) who bet on Category C.
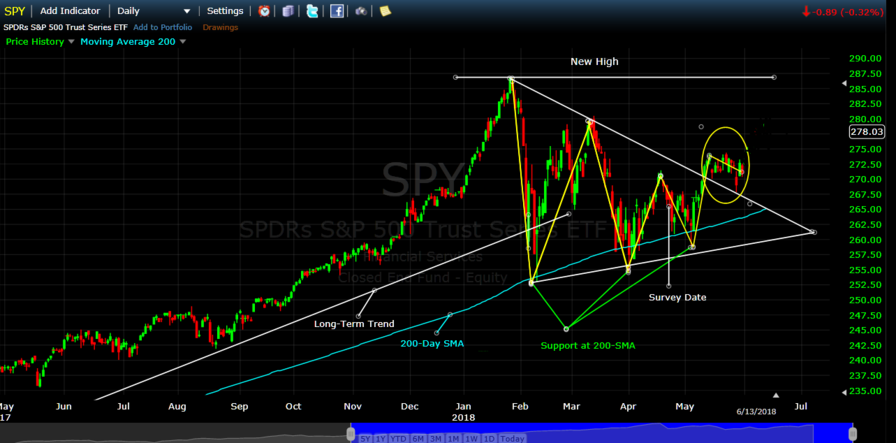
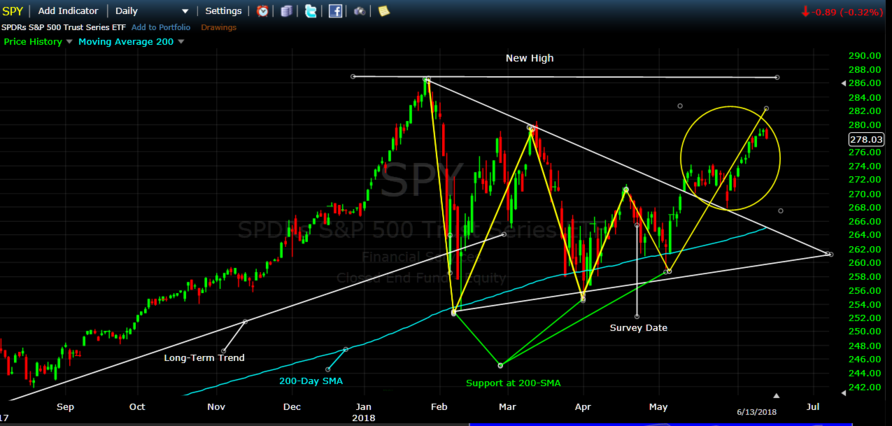
Since the time period for this first survey was so short, we have decided to "Extend" the survey until the
end of August, with the same rules. Therefore, as can be seen in the graph below, since the SPY did not
go down immediately in April (Category D) nor stop near the top of the upper triangle line and head down
in May (Category C), the only members/followers who are eligible for the the Extended Survey are those
from Categories A and B.
I'm betting on Category C, but am glad that we have MIPS and don't need to "guess" what to do next...
Paul Distefano, PhD
CEO / Founder
MIPS Timing Systems, LLC
Houston, TX
281-251-MIPS(6477)
Sunday, May 27 2018
Most "things" are looking good, so it seems to me that we will have more upside coming next week:
- lots of good "stuff" in the economic world,
- good fundamentals in stocks and bonds,
- good technical analytics (see breakouts below) and
- good geopolitical info (Turmp/N.Korea summit meeting, etc)
That is just my opinion, so thanks that we have MIPS to tell us what to do next !!!
-----------------------------------------------------------------------------------------------
Index graphs through Friday 5/25/18 ...
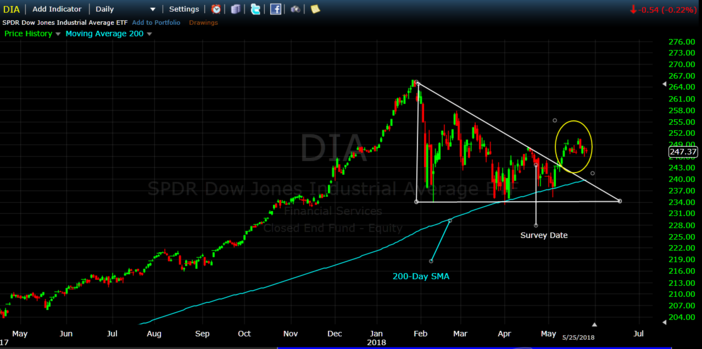
DOW / DIA
SP 500 / SPY
NASDAQ / QQQ
Good trading...
Paul Distefano, PhD
CEO / Founder
MIPS Timing Systems, LLC
Houston, TX
281-251-MIPS(6477)
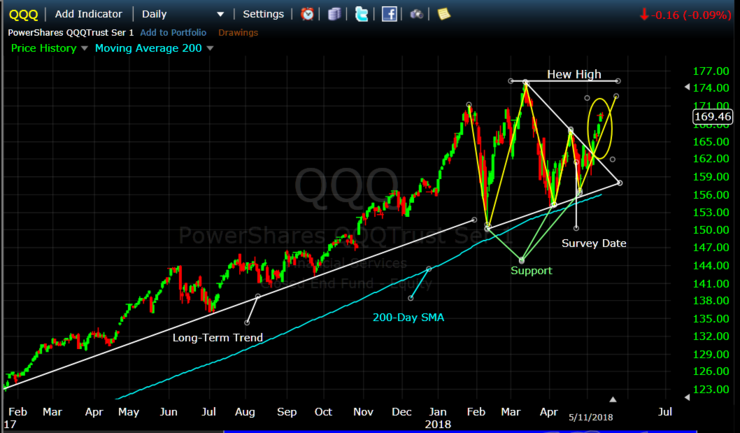
Friday, May 11 2018
Last week all markets made good moves up... Will that continue?
- please be aware that this behavior could reverse itself with NO warning...
- let's not guess, but wait for MIPS to tell us what to do next !!!
Today's graphs compared to last Friday's close (in 5/04/18 email below):
DOW / DIA
SP 500 / SPY
NASDAQ / QQQ
Good trading...
Paul Distefano, PhD
CEO / Founder
MIPS Timing Systems, LLC
Houston, TX
281-251-MIPS(6477)
=================================================================
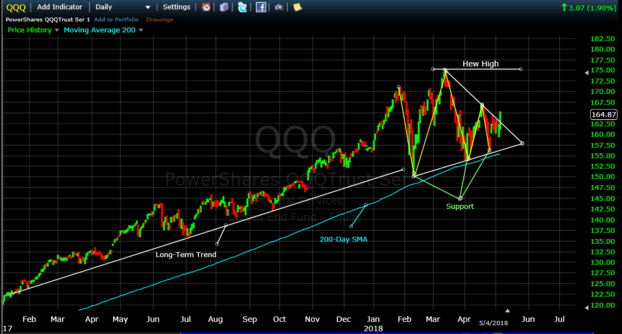
From 5/04/18
MIPS Members:
We never really know which way the market is heading in the near-term future (like in the next few weeks/months). But, there are some "patterns" that tell us where to start looking.
In this blog, we are concentrating on "triangle patterns" (aka TP). Like other patterns, TP comes into play after the market has made a long-term run, and has run out of steam. Because the bulls/bears are not willing to make a stand one way or the other, the TP acts like most other "Consolidation" pattern (sideways, but with defined, squeezing limits up and down). See below...
The good news is that, most of the time, the market makes future big moves in the direction that the market breaks out of the pattern. And, my experience shows that the market usually breaks out in the direction that it was moving before the pattern was formed (and, this time it was moving up) !!!
- Warning: that is just my opinion and has nothing to do with MIPS.
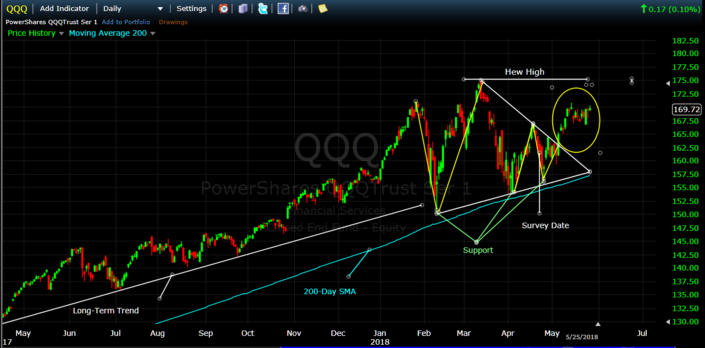
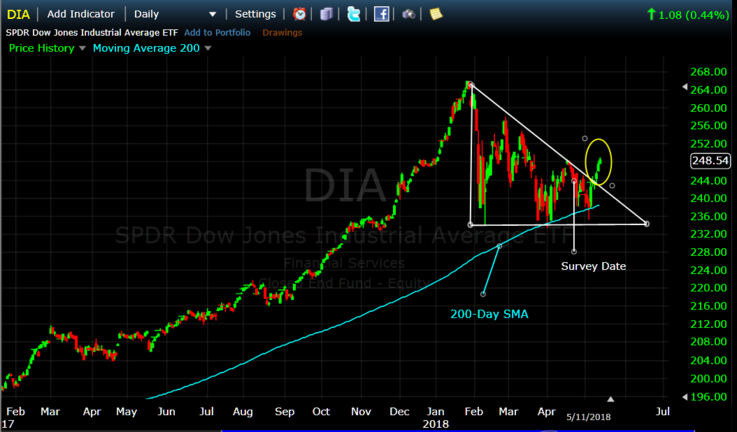
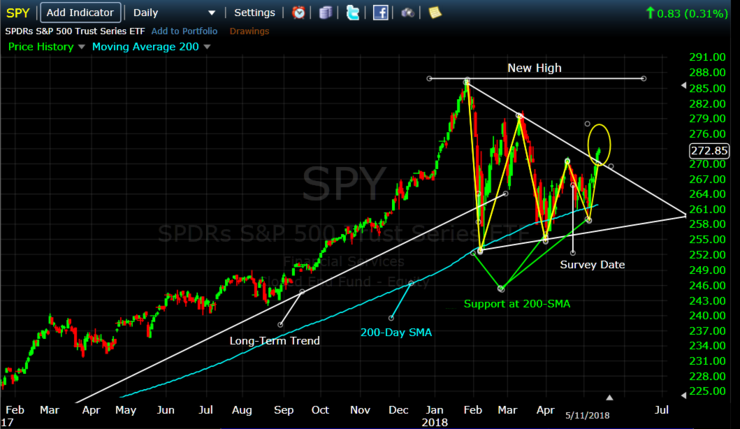
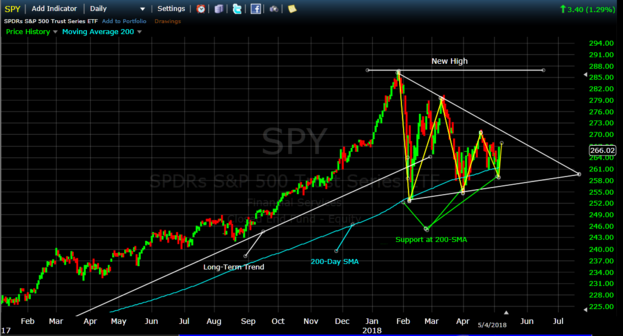
Graphs of the current state of the Dow (DIA), the SPY, and the Nasdaq (QQQ) are shown below.
Status:
1) DIA - hitting the tops and bottoms to near perfection - with the upside looking stronger
2) SPY - following the pattern and struggling to move to the upside, and
3) QQQ - has already broken out to the upside.
DOW / DIA

SP500/ SPY
NASDAQ / QQQ
Good Trading...
Paul Distefano, PhD
CEO / Founder
MIPS Timing Systems, LLC
Houston, TX
281-251-MIPS(6477)
support@mipstiming.com
www.mipstiming.com
Sunday, May 06 2018
We never really know which way the market is heading in the near-term future (like in the next few weeks/months). But, there are some "patterns" that tell us where to start looking.
In this blog, we are concentrating on "triangle patterns" (aka TP). Like other patterns, TP comes into play after the market has made a long-term run, and has run out of steam. Because the bulls/bears are not willing to make a stand one way or the other, the TP acts like most other "Consolidation" pattern (sideways, but with defined, squeezing limits up and down). See below...
The good news is that, most of the time, the market makes future big moves in the direction that the market breaks out of the pattern. And, my experience shows that the market usually breaks out in the direction that it was moving before the pattern was formed (and, this time it was moving up) !!!
- Warning: that is just my opinion and has nothing to do with MIPS.
Graphs of the current state of the Dow (DIA), the SPY, and the Nasdaq (QQQ) are shown below.
Status:
1) DIA - hitting the tops and bottoms to near perfection - with the upside looking stronger
2) SPY - following the pattern and struggling to move to the upside, and
3) QQQ - has already broken out to the upside.
DOW / DIA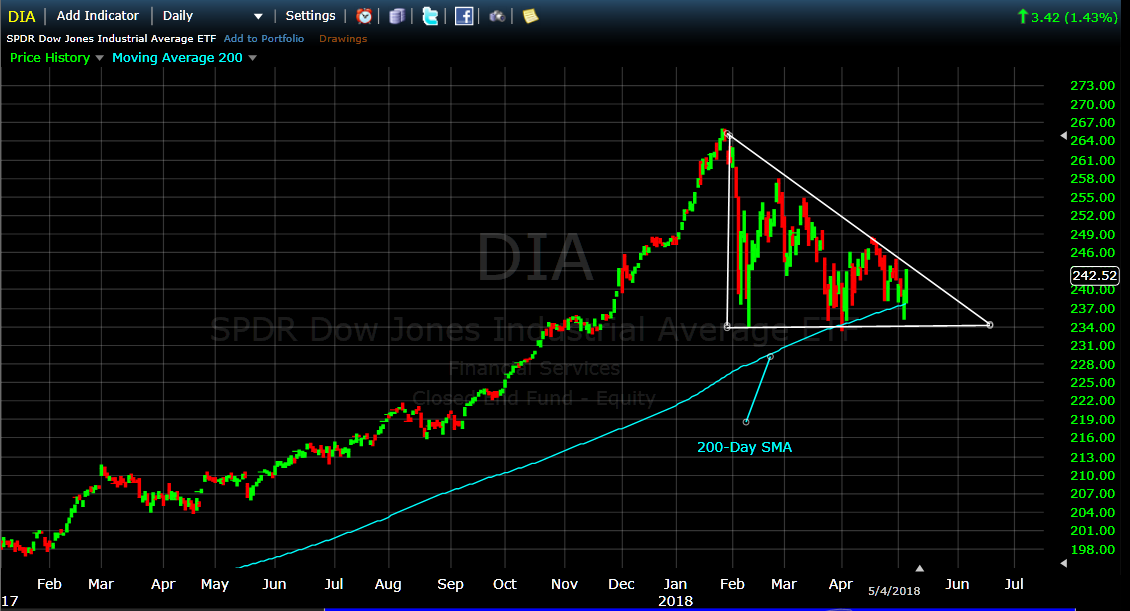
SP500/ SPY

NASDAQ / QQQ

Good Trading...
Paul Distefano, PhD
CEO / Founder
MIPS Timing Systems, LLC
Houston, TX
281-251-MIPS(6477)
support@mipstiming.com
www.mipstiming.com
|


