site map
my account
contact
our facebook page
Latest Posts
Archive

+
...

Market Timing

Friday, March 02 2012
The SPY closed at $136.63 on Thursday...

The current upside resistance is at $137.2, less than 1/2 of 1% above this close (see graph below)
- there is a good chance that the SPY will break this resistance level to the upside on Friday
- since we are still long, let's hope so
- if that happens, we could have smooth sailing because the next upside resistance is about 6.6% higher !!!

Of course, the market is not always that accommodating.  So, if the SPY doesn't break up (or breaks up and falls back quickly), MIPS will get us out.

Posted by: Dr. G. Paul Distefano AT 02:56 pm   |  Permalink   |  Email
Sunday, October 16 2011
There are lots of "experts" that suggest that the market has established a new, long-term up trend. On a very short-term basis (days), they are correct.

MIPS is looking for long-term trends (weeks/months). See the graph below. MIPS is looking for trends that develop after the market breaks out of a trading range (as in 3Q'09), but NOT the short-term swing trends within the trading range.


So, where is the market at this time
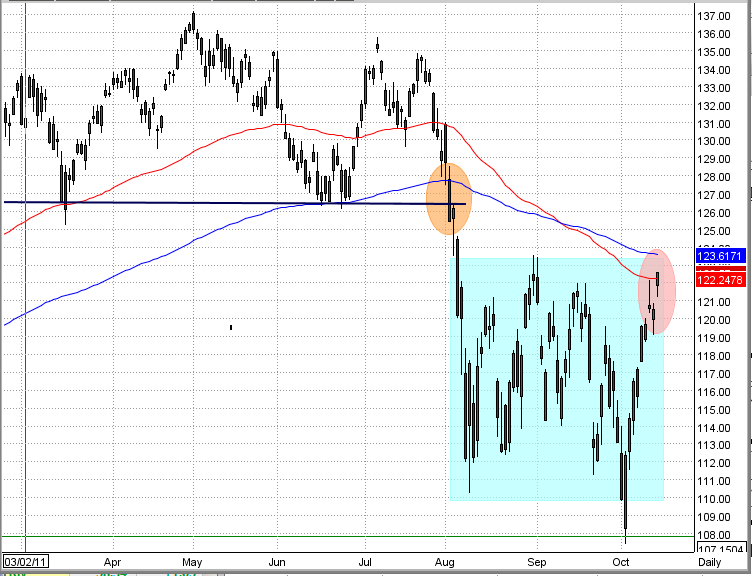
The graph below shows that:
1) The SPY broke its 200-day EMA and the neckline of a head-and-shoulders top on 8/2/11
2) The SPY has been in a volitile "trading range" for 10 weeks (2-1/2 months)
3) The SPY is at another "critical point" at the upper end of its trading range; AND it is between
     its 100-day EMA and its 200-day EMA.
4) Many investors see this as positive because of the short-term up trend; but "channel traders"
    will see it at the top of its trading range and will sell/short SPY at the top of its trading range.


What does the past tell usLook at the chart below from 2007.
1) You should see the similarity between 2007 and today.
2) In 2007, the SPY broke the neckline of its head-and-shoulders top and 200-day EMA, and went into
    a 2-1/2 month "trading range" (sound familar?).
3) After a strong "bounce back" that would suggest a new up trend (like today), the SPY truned around 
    at the top of this trading range, broke through the bottom of the trading range, and continued down
    for 18 months, resulting in a 55% drop from the Oct'07 top.


The majority of the commercially available market timing systems have been through hell with this trading range (getting whipsawed) and MIPS has had some problems itself. [Of course, there are some high-frequency trading models (100 trades/year) that may have "caught" the top of some of these waves and done well, but they are in the minority.]

The market will eventually break out of this trading range (like it always does), and MIPS will tell us what to do. Over time, MIPS performs as well or better that most other timing system, most of the time with 1/5th as many trades.
Posted by: Dr. G. Paul Distefano AT 12:10 pm   |  Permalink   |  Email
Sunday, August 21 2011
Please Learn This:
- the result from shorting the market seems like "magic", but it is not!
- but, if you don't know what you are doing, you could lose big

1) Let's take the SPY from 2000 - 2007
    - the SPY went from 150 (2000)  to  75 (2003) back  to  150 (2007)
 
2) With a buy/hold strategy, you would have been down 50% in 2003, and back to "even" in 2007.  [BTW, you would not really be close to "even" because you would have been up 50% in 7 years with a 6% corp bond, like GE.]
 
3) If you used a buy/short strategy with a "perfect" system, you would have made 50% on your money in 2003 by being short
   - then, when you went from short to long in 2003, you would have would now own three times as many shares of SPY (1.5 times your original money, buying at 1/2 the price)
   - now, when the SPY went back to 150 (from 75 to 150), using a buy/short strategy, you would have had 3 times the money that you started with.

Of course, no one has a "perfect" system, but MIPS is a very good one.
- from 12/31/2007 to 8/19/2011, the SPY is down 23%, and MIPS is up 278% (see graph below for MIPS performance from TimerTrac.com)
- so starting with $100,000, you would have $77,000 with buy/hold vs $378,000 with MIPS buy/short !!!!!
 

And, YTD in 2011, the SPY is down 11% and MIPS is up 18% (a 29% difference)...
Posted by: Dr. G. Paul Distefano AT 02:28 pm   |  Permalink   |  Email

MIPS Timing Systems
P.O. Box 925214
Houston, TX  77292

An affordable and efficient stock market timing tool. Contact MIPS
281-251-MIPS (6477)
E-mail: support@mipstiming.com