Saturday, November 18 2017
Some investors (including some MIPS members) seem to think that when there is not a position change (Signal Change) in a MIPS model for a long period of time, they are being ignored or something is wrong with the model that they are following. They can't seem to understand that a good model (like MIPS) only changes position when the market changes its behavior, and that change is detected by the model. With MIPS, this would be when the intermediate-term market "trend" changes direction. We at MIPS input data and run our models daily (in triplicate), independent of whether or not there is a change of any type.
All daily model developers (including MIPS) provide their subscribers with "Investment Positions" (Long or Short or Cash) about 250 days every year (52 weeks/year x 5 trading days/week - holidays). This is not a function of how often their models trade.
There is, however, a big difference in how these "Investment Positions" are reported amongst model developers (aka Signal Providers):
1) Some Signal Providers send out emails to subscribers with current positions every trading day, whether or not the signal has changed. Many subscribers do not like this because they get inundated with emails from their Signal Provider and many times they miss a "signal change" due to confusion or boredom.
2) Other Signal Providers only send out emails to subscribers when there is a change in position from their model. Subscribers don't like this because there can be long periods of time (weeks/months) when they don't hear from their Signal Provider, and hence they are not 100% sure that they did not miss a signal change somewhere along the way or that the Signal Provider is now inactive.
3) At MIPS (as with most other good Signal Providers), we send out
(a) A "Signal Change" email the very day that one of our models calls for a change in position
(Long-to-Short or Short-to-Cash or etc.)
(b) A "Signal Status" email every weekend showing the current position for all MIPS models.
Our subscribers like this because the "Signal Status" tells them if they are in the correct
position at that time.
The moral of this story is that MIPS runs its models each and every day, no matter what the market is doing. This includes the status and behavior of hundreds of technical indicators and mathematical equations, and thousands of calculations. it is NOT any easier to run the model when the current signal remains the same or when there is a signal change.
We report the results to you every time there is a Signal Change, with instructions on our website for you NOT to change this new position until there is another Signal Change issued by the MIPS model that you are trading with. In the meantime, we keep you up-to-date on the Signal Status for each MIPS model every weekend, in case you accidentally did not act on the latest Signal Change during the week.
Here are the trades (red dots) and performance of the MIPS3 model since 2016
Blue Line - MIPS3 1.5x Long / 0.5x Short +39%
Green Line - MIPS3 1.0x Long / 1.0x Short +27%
Red Line - SPY........................................... +27%
Red dots show actual trades
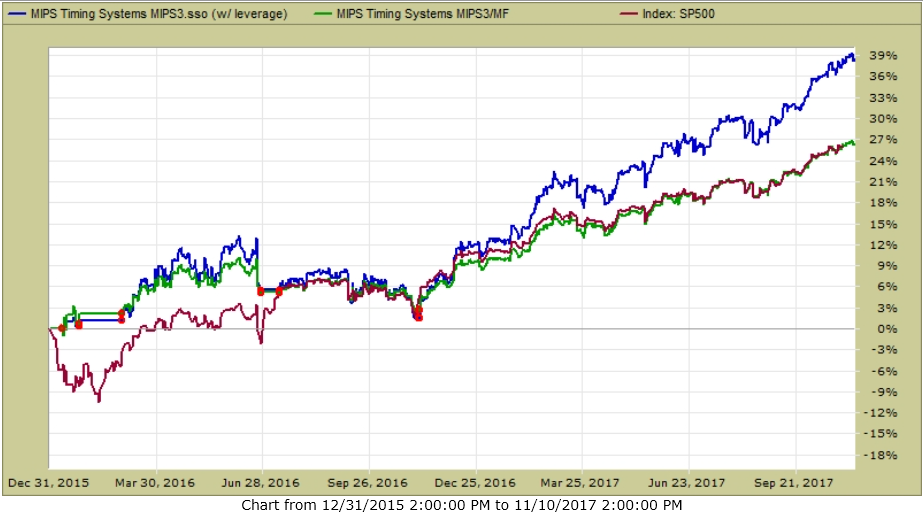
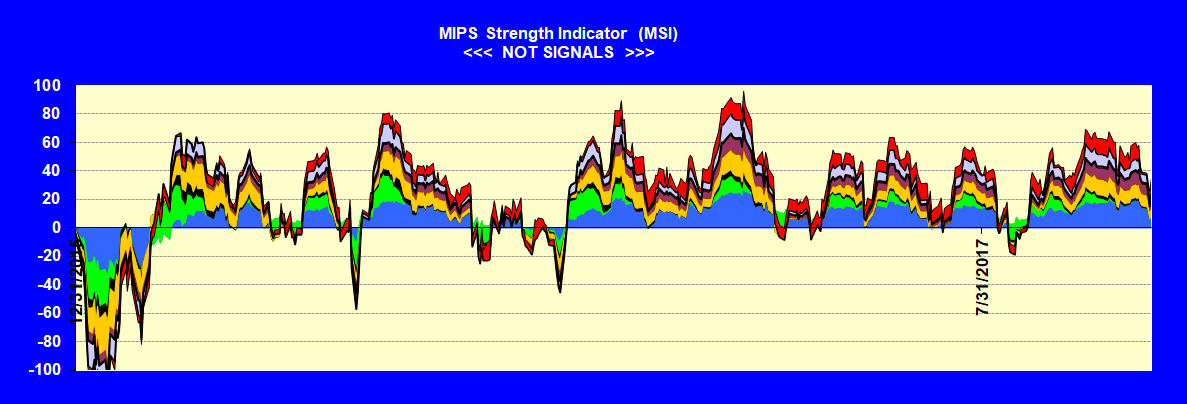
As you can see in the graph above, the last trade was in Nov 2016, and the trend has been very
consistent since then. In the graph below, you can see that the MIPS Strength Indicator shows little or no weakness (until last week).
Best Wishes...
Paul Distefano, PhD
MIPS Timing Systems, LLC
Houston, TX
281-251-MIPS(6477)
Monday, October 30 2017
I am writing this for five reasons:
I.) to explain how and why a MIPS trading signal (which gets to our subscribers in a “Signal Change” email)
can last for a really long time (so-called “signal life”),
II.) to clarify how MIPS issues new signals and how we make our subscribers aware of the “Signal Status” for
each MIPS model EVERY DAY,
III) to show that more (unnecessary) trading usually yields worse results,
IV) to show the MIPS performance over the last 12 months, with and without leverage, and
V.) to show how MIPS3 performed in 2008
-------------------------------
I.) All good timing models have a foundation upon which they determine if investors should be in a Long, Short, or Cash position. Some of the underlying “foundations” of these models are trend following, reversion to the mean, momentum, relative strength, rate of change, etc. In general, the MIPS models are Trend Following models. But, believe it or not, they contain some of all of the above foundations (the MIPS models contain up to 165 standard technical indicators, artificial intelligence, pattern recognition, and applied math algorithms).
MIPS’ strength lies in its ability to determine when the market has “turned over” from up-to-down or from down-to-up (mathematically called “Inflection Points”).
We all know that the market basically moves in “cycles”; from short-term (days to weeks), to intermediate-term (weeks to months), and to long-term cycles (months to years). And, an intermediate-term cycle basically ignores short-term cycles and a long-term cycle ignores both short-term and intermediate-term cycles.
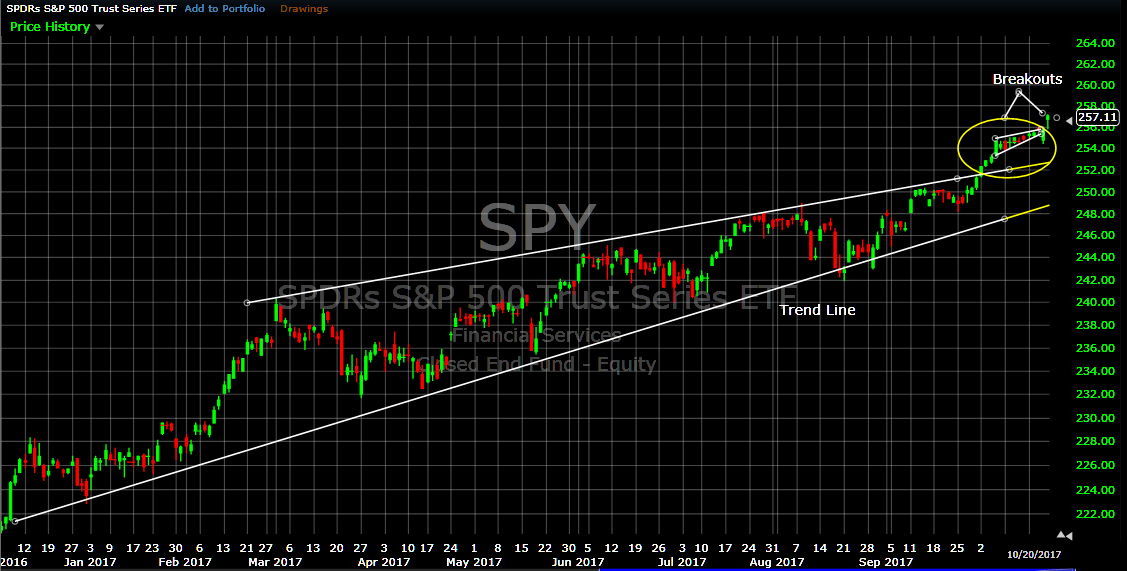
MIPS tracks intermediate-term cycles. “Cycles” in the stock market move from tops-to-bottoms, and then turn around and move from bottoms-to-tops. An up-trend is a series of higher highs and higher lows, and the up-trendline is a line along the bottoms (and the inverse for a down-trendline). See graph below.
A good trend following model will rarely change position unless the market breaks the trendline with force, and which has the support of a strong majority of the other technical algorithms confirming a market breach in the current direction.
With enough strength in a strong up-market, an intermediate-term cycle can turn into a long-term cycle. As can be seen in the graph below, in the last 12 months the market has moved up on what could be called a “near-perfect” up-trend, AND all of the MIPS models have remained LONG during this entire period (a new record of time for a MIPS “signal life”).
Remember, a good timing model not only needs to know when to trade, but it also needs to know when NOT to trade.
BTW:
The S&P 500 just set an all-time record for the number of consecutive days when the S&P 500 did not have a 3% loss. As of today’s date (10/30/2017) that would be very close to one year (247 trading days) !!! Of course, this usually means that it is very difficult for most timing models to “trade the dips”. It would be better to stay long with some leverage (like 1.5x leverage).
.
-------------------------------
II.) Moving on to Section II in this Blog, the MIPS models send out “Signal Change” emails every time that any one or more of the models instructs MIPS subscribers to “change” position (like from Long-to-Short, or from Short-to-Cash, etc). Of course, at MIPS we “run the models” EVERY DAY (in triplicate) to determine if any of the MIPS signals have changed. If so, we send out a "Signal Change" email after the close that day. If not, we send "Signal Status" emails to our subscribers every weekend. This way, if a subscriber missed a Signal Change email or forgot to trade it, they will be aware over the weekend that they missed a Signal Change.
A few market timers send out daily Signal Status emails. But we (along with most others), do not do so mainly because most of our subscribers and RIA customers do not want to be inundated with emails from MIPS unless there is a Signal Change (remember, there are about 240-250 trading days each year). Unfortunately, because we do not send out daily emails, some subscribers feel as if we are not paying attention to MIPS or the markets, which of course, is dead wrong.
-------------------------------
III) Regarding trading frequency, no one should change a winning position (execute another trade) unless the trend that the model is tracking has changed direction (in other works, “Don’t Fight The Trend”). And remember when you make a trade (like buy) you will ultimately need to reverse that trade (like sell or short). So, on each new trade, you must be correct on when to buy AND when to sell. A good example of this can be displayed by showing the performance of most of the timing models that were tracked by TimerTrac.com over the last 12 months (see Table below).
The table below from TimerTrac.com over the last 12 months shows (a) the performance (Gain/Loss %) with no leverage, and (b) the number of trades from over 75 of the models that it tracks. The MIPS models are at (or near the top), with only 2 trades from MIPS3 and no new trades from MIPS4 and Nitro.
Average:
Over the last 12 months
- the MIPS models averaged a gain/loss of 21.2%, with a average of 1 trade each.
- other models with over 80 trades averaged a gain/loss of -13.3%, with an average 117 trades each.
PS – Of course, this does NOT mean that models that trade less perform better…
Long-Term trading
Since Nov’05, the MIPS models have averaged 12-15 trades/year, with the lower ones being 2-4 trades/year and the high end being 16-20 trades/year. In the 18 months of the last market crash (Oct’07 – Mar’09) MIPS3 issued 18 trades.
|
|
|
|
|
|
|
|
|
|
|
|
|
|
|
|
|
|
|

|
|
|
|
|
Top Performers over the period from Monday, October 31, 2016 through Friday, October 27, 2017
|
|
The index SP500 gained 21.38% over this same time period.
|
|
|
|
|
|
|
|
|
|
Rank
|
Strategy Name
|
Gain/Loss %
|
Difference %
|
Trades
|
|
1
|
|
21.40%
|
0.01%
|
6
|
|
2
|
MIPS Timing Systems MIPS/Nitro
|
21.38%
|
0.00%
|
0
|
|
2
|
MIPS Timing Systems MIPS4.sso
|
21.38%
|
0.00%
|
0
|
|
2
|
|
21.38%
|
0.00%
|
0
|
|
2
|
|
21.38%
|
0.00%
|
0
|
|
2
|
|
21.38%
|
0.00%
|
0
|
|
2
|
|
21.38%
|
0.00%
|
0
|
|
2
|
|
21.38%
|
0.00%
|
0
|
|
2
|
|
21.38%
|
0.00%
|
0
|
|
2
|
|
21.38%
|
0.00%
|
0
|
|
2
|
|
21.38%
|
0.00%
|
0
|
|
2
|
|
21.38%
|
0.00%
|
0
|
|
2
|
|
21.38%
|
0.00%
|
0
|
|
2
|
|
21.38%
|
0.00%
|
0
|
|
2
|
|
21.38%
|
0.00%
|
0
|
|
3
|
|
21.38%
|
0.00%
|
6
|
|
4
|
MIPS Timing Systems MIPS3/MF
|
20.93%
|
-0.46%
|
2
|
|
5
|
|
20.79%
|
-0.59%
|
31
|
|
6
|
|
20.47%
|
-0.91%
|
2
|
|
7
|
|
18.99%
|
-2.39%
|
17
|
|
8
|
|
18.37%
|
-3.02%
|
94
|
|
9
|
|
18.05%
|
-3.33%
|
99
|
|
10
|
|
18.01%
|
-3.38%
|
7
|
|
11
|
|
17.77%
|
-3.61%
|
7
|
|
12
|
|
17.63%
|
-3.75%
|
6
|
|
13
|
|
17.53%
|
-3.85%
|
14
|
|
14
|
|
17.36%
|
-4.02%
|
8
|
|
15
|
|
17.08%
|
-4.30%
|
7
|
|
16
|
|
15.95%
|
-5.43%
|
3
|
|
17
|
|
15.43%
|
-5.95%
|
5
|
|
18
|
|
15.29%
|
-6.09%
|
15
|
|
19
|
|
14.76%
|
-6.62%
|
23
|
|
20
|
|
14.63%
|
-6.75%
|
3
|
|
21
|
|
14.37%
|
-7.01%
|
132
|
|
22
|
|
13.81%
|
-7.58%
|
132
|
|
22
|
|
13.81%
|
-7.58%
|
132
|
|
23
|
|
13.75%
|
-7.63%
|
24
|
|
24
|
|
13.08%
|
-8.30%
|
52
|
|
25
|
|
12.91%
|
-8.47%
|
49
|
|
26
|
|
12.71%
|
-8.67%
|
3
|
|
27
|
|
12.27%
|
-9.11%
|
42
|
|
28
|
|
12.16%
|
-9.22%
|
16
|
|
29
|
|
11.90%
|
-9.48%
|
12
|
|
30
|
|
11.64%
|
-9.74%
|
35
|
|
30
|
|
11.64%
|
-9.74%
|
35
|
|
30
|
|
11.64%
|
-9.74%
|
35
|
|
30
|
|
11.64%
|
-9.74%
|
35
|
|
30
|
|
11.64%
|
-9.74%
|
35
|
|
30
|
|
11.64%
|
-9.74%
|
35
|
|
31
|
|
11.41%
|
-9.97%
|
12
|
|
32
|
|
11.40%
|
-9.98%
|
16
|
|
33
|
|
11.32%
|
-10.07%
|
56
|
|
34
|
|
11.23%
|
-10.15%
|
50
|
|
35
|
|
11.16%
|
-10.22%
|
55
|
|
36
|
|
10.89%
|
-10.49%
|
10
|
|
37
|
|
10.71%
|
-10.67%
|
63
|
|
38
|
|
10.69%
|
-10.69%
|
81
|
|
39
|
|
10.66%
|
-10.72%
|
24
|
|
40
|
|
9.37%
|
-12.02%
|
17
|
|
41
|
|
8.83%
|
-12.55%
|
59
|
|
42
|
|
8.33%
|
-13.05%
|
90
|
|
43
|
|
8.00%
|
-13.38%
|
12
|
|
44
|
|
7.59%
|
-13.79%
|
4
|
|
45
|
|
7.32%
|
-14.07%
|
22
|
|
46
|
|
7.20%
|
-14.19%
|
10
|
|
47
|
|
7.10%
|
-14.28%
|
55
|
|
48
|
|
6.93%
|
-14.45%
|
7
|
|
49
|
|
6.88%
|
-14.50%
|
9
|
|
50
|
|
6.81%
|
-14.57%
|
21
|
|
51
|
|
6.60%
|
-14.78%
|
240
|
|
52
|
|
6.01%
|
-15.37%
|
43
|
|
53
|
|
5.75%
|
-15.63%
|
9
|
|
54
|
|
5.70%
|
-15.68%
|
152
|
|
55
|
|
5.69%
|
-15.69%
|
15
|
|
56
|
|
4.89%
|
-16.50%
|
49
|
|
57
|
|
4.88%
|
-16.50%
|
12
|
|
58
|
|
4.80%
|
-16.58%
|
10
|
|
59
|
|
4.64%
|
-16.74%
|
2
|
|
60
|
|
4.56%
|
-16.82%
|
12
|
|
61
|
|
4.31%
|
-17.07%
|
96
|
|
62
|
|
3.84%
|
-17.54%
|
234
|
|
63
|
|
3.59%
|
-17.79%
|
18
|
|
64
|
|
3.21%
|
-18.17%
|
14
|
|
65
|
|
3.17%
|
-18.22%
|
3
|
|
65
|
|
3.17%
|
-18.22%
|
3
|
|
65
|
|
3.17%
|
-18.22%
|
3
|
|
65
|
|
3.17%
|
-18.22%
|
3
|
|
66
|
|
2.35%
|
-19.03%
|
19
|
|
67
|
|
2.19%
|
-19.19%
|
23
|
|
68
|
|
0.00%
|
-21.38%
|
0
|
|
68
|
|
0.00%
|
-21.38%
|
0
|
|
68
|
|
0.00%
|
-21.38%
|
0
|
|
68
|
|
0.00%
|
-21.38%
|
0
|
|
68
|
|
0.00%
|
-21.38%
|
0
|
|
68
|
|
0.00%
|
-21.38%
|
0
|
|
68
|
|
0.00%
|
-21.38%
|
0
|
|
69
|
|
-0.53%
|
-21.91%
|
2
|
|
70
|
|
-0.81%
|
-22.20%
|
2
|
|
71
|
|
-0.85%
|
-22.24%
|
120
|
|
72
|
|
-1.65%
|
-23.04%
|
87
|
|
72
|
|
-1.65%
|
-23.04%
|
87
|
|
73
|
|
-2.78%
|
-24.16%
|
12
|
|
74
|
|
-3.60%
|
-24.98%
|
13
|
|
75
|
|
-5.60%
|
-26.98%
|
1
|
|
76
|
|
-15.28%
|
-36.66%
|
32
|
---------------------------------
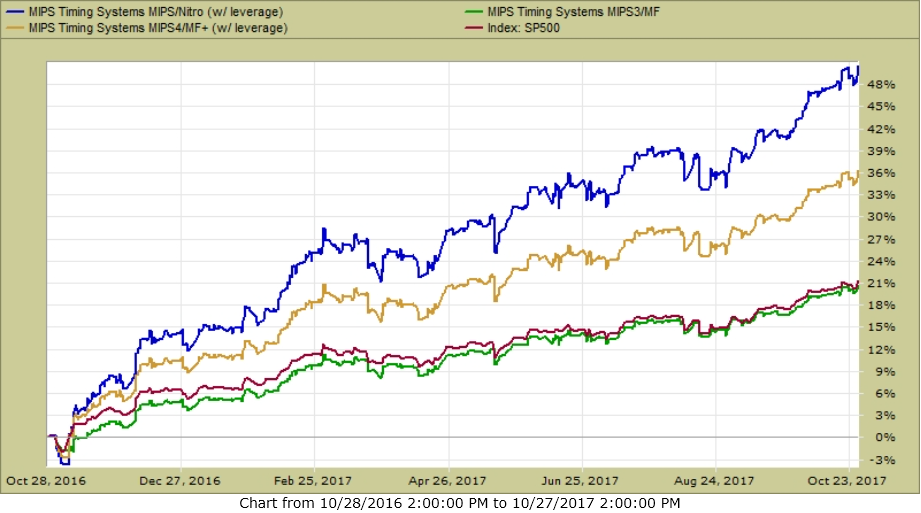
IV) MIPS performance over the last 12 months (from TimerTrac.com)
- MIPS/Nitro with 2x leverage (blue line) + 50%
- MIPS4 with 1.5x leverage (gold line) + 36%
- MIPS3 with no leverage (green line) +21%
- SPY (red line) +21%
.
-----------------------------------
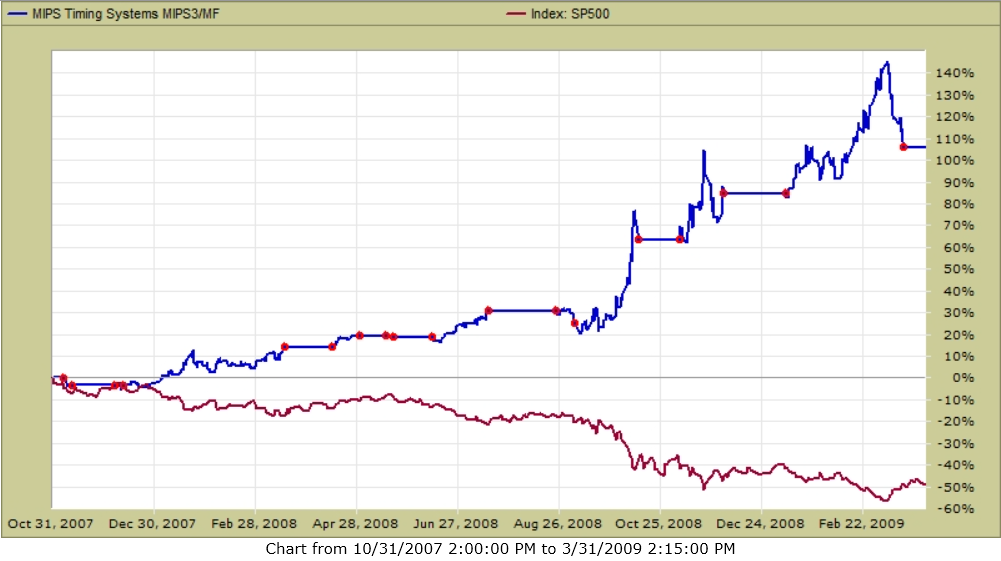
V.) How did MIPS perform in 2008
The graph below is:
(a) to prove that MIPS not only performs well in up markets, but also
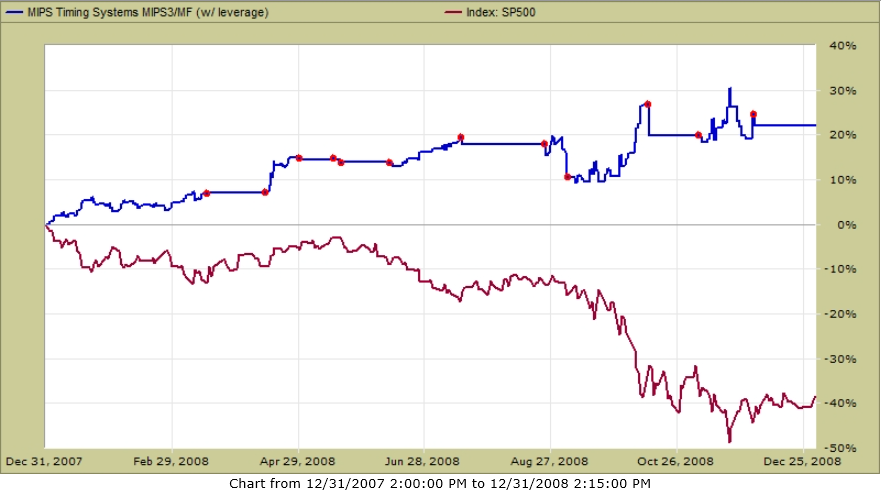
(b) to show how fast MIPS3 actually responded to the market crash in 2008.
- MIPS3 issued its first short signal in 4Q’07 (verified by TimerTrac.com),
MIPS3 – 4Q’07 thru 1Q’09
- MIPS3 - blue line +106%
- SPY - red line -48%
Red dots indicate actual signals …
 . .
In summary, it seems that many “investors” get such a big “kick” out of trading, they lose track of the objective of making money. Many will not tolerate a lower frequency trading model, but seem to love higher frequency trading models that do not perform nearly as well as MIPS. You tell me why…
.
--------------------------------
Best Wishes…
Paul Distefano, PhD
CEO / Founder
MIPS Timing Systems, LLC
Houston, TX
281-251-MIPS(6477)
Support@mipstiming.com
www.mipstiming.com
Sunday, October 22 2017
Recently it seems that the major concern from almost all investors in the stock market is: “How much longer will this market continue to run up?” That is a very legitimate question, and it has a very simple answer (which, of course, is unusual in stock market behavior). More later …
BUT FIRST …
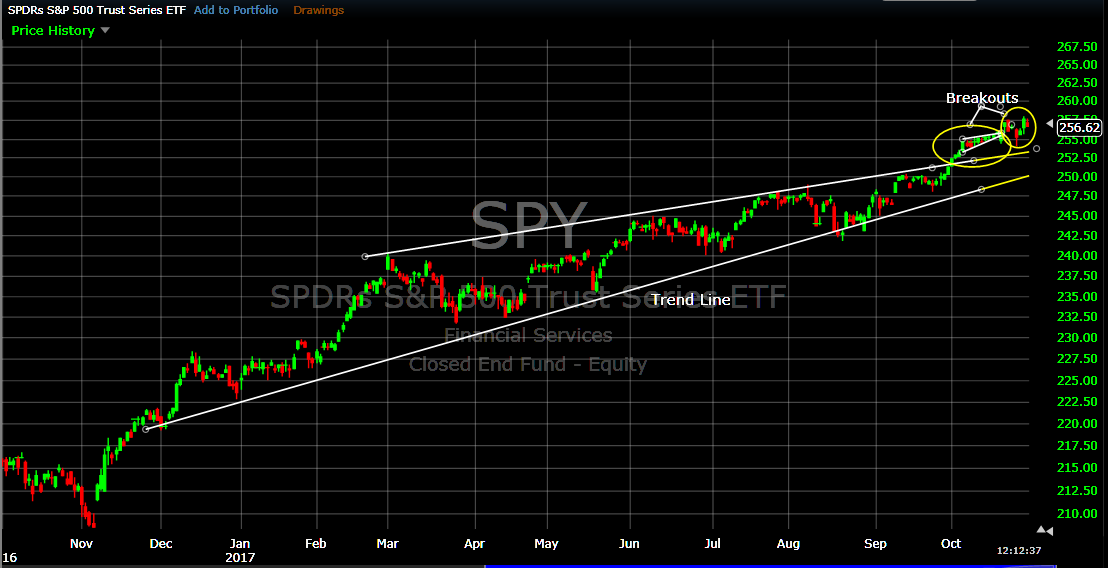
The recent Bull Run (since election in Nov’16) in this very strong Bull Market (since 2009) has been very consistent, and with very low volatility.
Some of the characteristics of this strong Bull Run are:
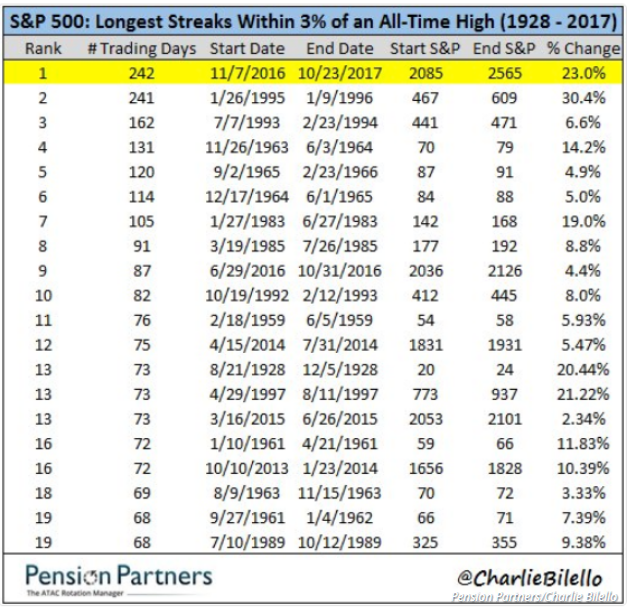
- Using data all the way back to 1928, this Bull Run has just tied an 11-month “streak” from the 1990’s where the market did not experience a “correction” worse than -3%.
- This is the first time in 20 years that the DOW was up for 8 quarters in a row.
- The Dow and SP500 experienced 9 monthly gains in a row, with both reaching multiple new highs in September.
Going forward, some interesting historical statistics from Market Watch (4th Quarter Reputation) are:
1) Historically the 4th quarter is the strongest quarter of the year.
2) Since 1950, the 4th quarter has been up 80% of the time, with an average growth
of nearly 4%.
3) September is usually the worst month the year, but not this year.
4) In 11 of the last 12 years, when the S&P 500 was up more than 10% through the
3rd quarter and it made a new high in September, the average 4th quarter returns
have been +5.9%.
WHAT IS DRIVING THIS MARKET?
Like almost all other times in the market, the ultimate driver of stock prices is CORPORATE EARNINGS. The market is certainly somewhat influenced by other things (like, inflation, interest rates, global instability, etc.), but these are not consistent predictors of future market direction. For example, over the last 20+ years, the market has moved both with and against inflation. So, when following anything other than earnings, usually the effect is temporary (like BREXIT) or way off in time.
From Morgan Stanley
Blue Line (Left Scale) = Earnings
Gold Line (Right Scale) = Stock Gains/Losses
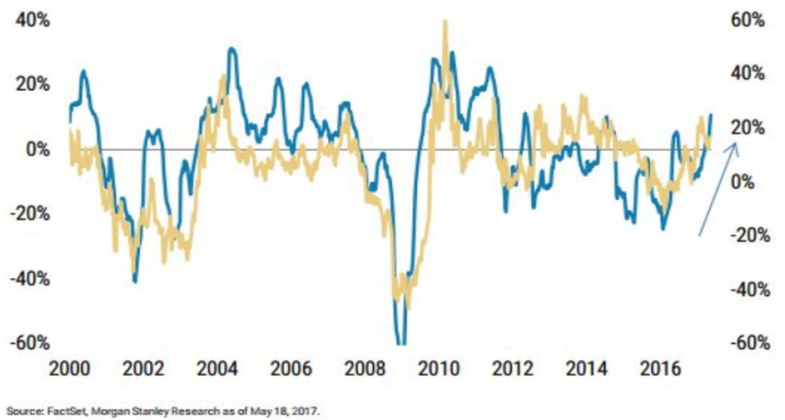
As can be seen above, stock prices ultimately follow corporate earnings. But in many cases, stock prices move first, in anticipation of earnings growth. The recent behavior in the market is a good example of this. Investors began pushing stock prices up immediately after the presidential election in anticipation of Trump’s economic agenda (fewer regulations, lower corporate taxes, better international tariffs, etc.) leading to more jobs and higher earnings. Since then, economic conditions have improved nicely and stock prices continue to rise.
So, why are so many investors so skeptical? Mainly because they feel that the stock market is greatly “oversold”, because stock prices are way too high as measured by the Price/Earnings (P/E) ratios of the major Indices. For example, the P/E ratio for the S&P 500 Index is now over 25, when the long-term average is closer to 15. That is indeed high and could lead to bad future returns; but it does not necessarily have to.
Many investors mistakenly interpret the above as a condition when prices must drop in order to bring the P/E ratio back down closer to past averages. BUT, what most of them seem to miss (or discount) is that the P/E ratio of an Index (like the S&P 500) also comes down when Earnings rise, even if stock Prices remain about the same. [Remember, the value of a “ratio” like A/B comes down when the denominator “B” goes up if the numerator “A” stays the same.] And, the “E” (earnings) in the PE ratio is now on the rise at a high pace and this should continue, given lower corporate taxes and more attractive international tariffs for US companies.
WARNING:
Please be aware that, if the economic progress in our country gets derailed (failed tax cuts, lower job creation, lower corporate earnings, North Korea, etc), the current Bull Run could (and most likely would) quickly “stop running” and it may even turn into a classic market crash.
So, how have the MIPS models performed in the last 12 months?
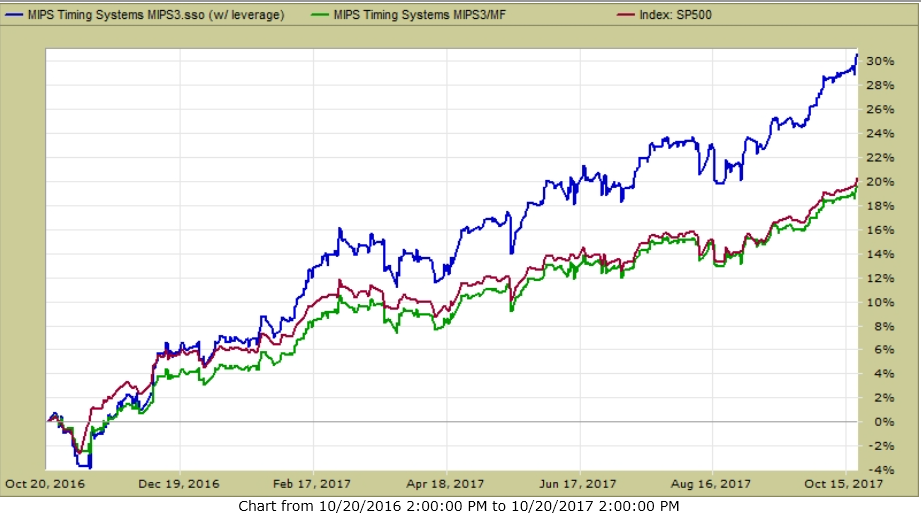
RECENT Performance of the MIPS3 model:
- 12 months ending 10/20/2017
- with and without leverage *
MIPS3 (last 12 months)
- Trading SPY Long / SH Short
Green Line 1.5 x Long / 0.5x Short +31%*
Blue Line 1.0x Long / 1.0x Short +20%
Red Line - SPY Buy/Hold +21%
Best Wishes…
Paul Distefano, PhD
MIPS Timing Systems, LLC
Houston, TX
281-251-MIPS(6477)
Monday, October 02 2017
Can anyone develop a "perfect timing model"? Not at this time, but with advances in quantitative modeling (applied mathematics, artificial intelligence, pattern recognition, big data, etc.), the accuracy of quantitative modeling is improving amazingly fast. In 10-15 years, computer trading will be dominant.
In fact, outside of the investment community, the rest of the world has had "near perfect" models in use for many years now. Some examples are: (a) auto-pilot in commercial aircraft, (b) auto-control of nuclear power plants, (c) rockets that send men to the moon and back safely, and (d) fighter jet software (F-15 and F-35) that seeks, finds, tracks, and shoots down enemy aircraft amazingly fast.
Immediately below, let's look at an illustration of a "Perfect Timing Model" beating buy-and-hold in the stock market. After that, we can see how a real timing model actually worked in 2007-2017, as verified by TimerTrac.com. Then, you can determine for yourself if a model like this is "near-perfect enough" for you, or if you think that you can do better yourself.
PERFECT TIMING MODEL
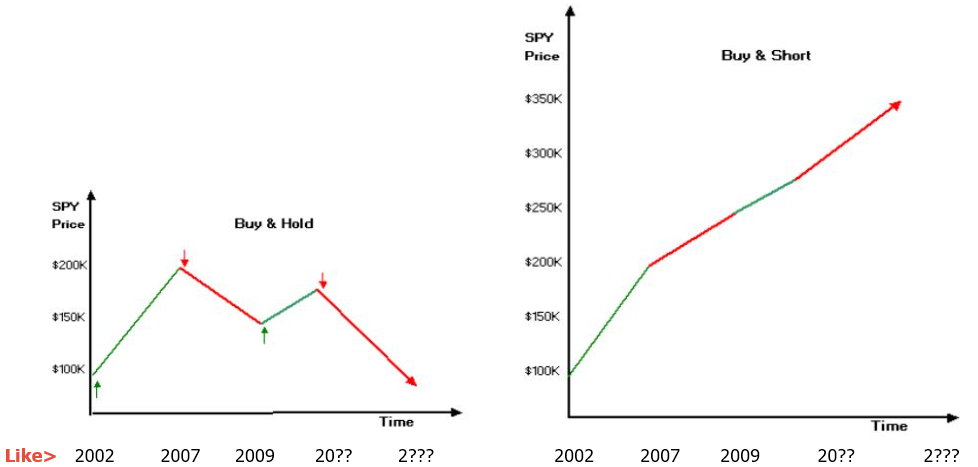
Every investor (large and small) wants to make money in both up and down markets, but they don't know how. Indeed, this is difficult but not impossible. The illustration below shows the hypothetical performance with both a Buy-and-Hold Strategy and a Perfect Timing Model (Buy/Short). Even though a perfect Timing Model does not exist, some models on the market today (like MIPS) come close as they soundly beat Buy/Hold over time.
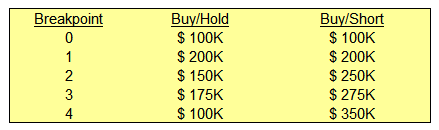
Let's suppose the market performs as in the table immediately below for 4 "Legs" of ups and downs:
I.) The middle column in the table and the graph below on the left show the performance of Buy/Hold.
II.) The rightmost column in the table and the graph on the right represent the performance of a
Perfect Timing Model.
A REAL TIMING MODEL (near perfect?)
The section shows the actual MIPS3/MF.org performance in a market moving something like that of the first 3 "Legs" depicted above, by using actual data from the period of 2007-2017 ytd (verified by TimerTrac.com). Why just 3 Legs? Because, since 2009. the market is still on the 3rd Leg. The next big drop will be like the 4th Leg above, and it is definitely coming.
If you asked hundreds of investors questions about investing in the stock market, you would get diverse answers to each question. There is one question, however, that they would all answer with a resounding "YES". That question is: "Would you have a lot more money today had you not lost 35-60% of your portfolio value in the market crashes in 2000 and 2008?"
That is why the primary objective for a stock market timing model should be to beat the major indices (like the S&P 500 ETF "SPY") in UP and DOWN markets. But, in real life, it would be more realistic to say that the objective should be to keep up with or beat the SPY in up markets, and either go to cash or soundly beat the SPY in down markets. It's sad to say that only a very few timing models meet that objective on a long-term basis. Most do well in up markets but not so well in down markets, or vice versa.
To this end, below you will find results from TimerTrac.com for our MIPS3/MF.org model between 2007 and 2017 ytd. For this, we traded with a popular investing strategy, namely 1.5x SPY Long and 0.5x SH Short (0.5x SH Short for lower risk).
|
Time Frame
|
SPY Buy/Hold
|
MIPS3.org
1.5x / 0.5x
|
| 2006 - 2007 |
+15.5% |
+20.5% |
| 2008 |
-38.5% |
+22.0% |
| 2009 - 2017 |
+170.0% |
+370.0% |
GRAPHS
The vertical "scales" on the graphs below are different from each other
(scales optimised to show the complete graph in the same space)
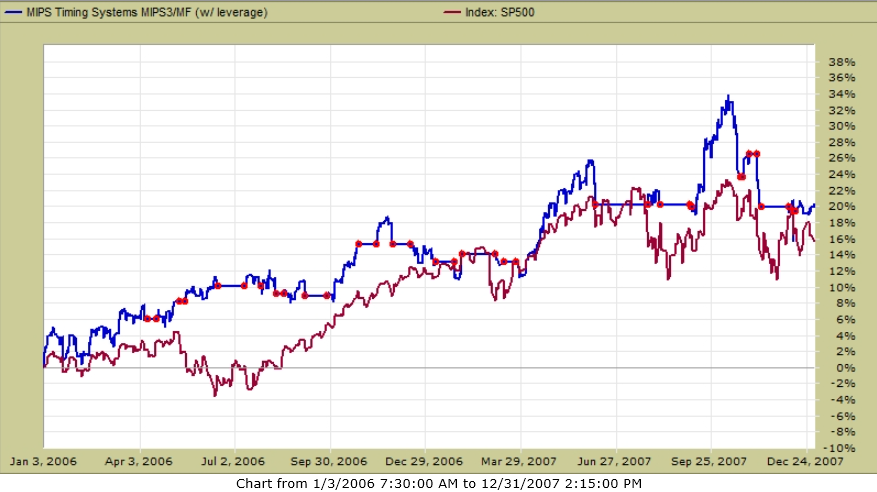
I.) MIPS3/MF.org
Trading 1.5x SPY / 0.5x SH
2006-2007 <==
Up Market
MIPS 1.5x Long /0.5x Short +20.5%
SPY Buy-and-Hold +15.5%
* Red dots designate trade dates
II.) MIPS3/MF.org
Trading 1.5x SPY / 0.5x SH
2008 <==
Down Market
MIPS 1.5x Long /0.5x Short +22.0%
SPY Buy-and-Hold - 38.5%
* Red dots designate trade dates
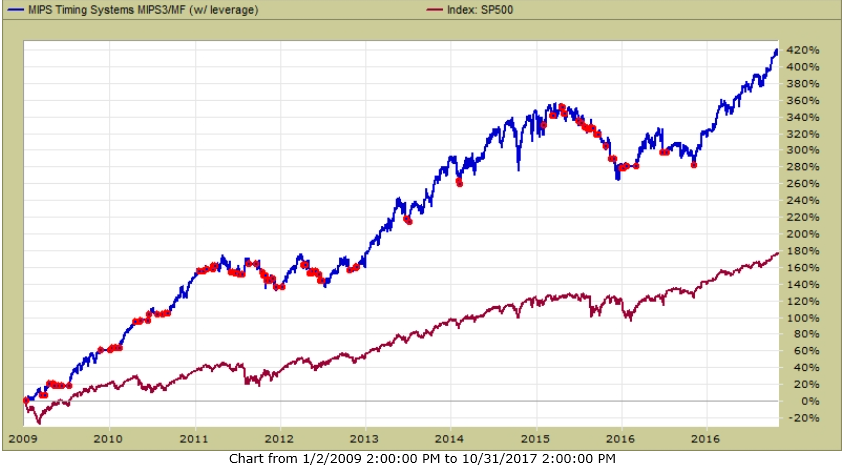
III.) MIPS3/MF.org
Trading 1.5x SPY / 0.5x SH
2009-2017 ytd <==
Up Market
MIPS 1.5x Long /0.5x Short +370%
SPY Buy-and-Hold +170%
* Red dots designate trade dates
Monday, September 25 2017
Evaluating Timing Models !!!
Stock market timing models are difficult to evaluate, but you do not have to completely understand the interworking of the models.
For any model you are considering investing with, you should at least know:
- What is the background of the model developer ?
- that is, is he/she qualified to develop a sophisticated timing model ?
- On average, how many times does the model trade every year ?
- some models issue about 12 trades/year and others over 100 times/year.
- Are the long-term performance results of the model outstanding ?
- for example, does the model beat buy-and-hold in both up and down markets ?
- to satisfy the above, your evaluation must include at least one market crash (as in 2008).
- Are the performance results Verified by a 3rd-party tracking company ? ***
- like, TimerTrac.com, ThetaResearch.com, etc.
*** Non-Verified Performance
If the hypothetical backtested (non-verified) performance of a model:
- comes from a company's first model, do not trust the results;
- comes from a company that has several older verified models that produced lousy performance results, do not trust the newer results;
- comes from a company that has several older verified models that produced very good performance, you can trust the results from the new models (because they usually retain 85-90% of the code/signals from the older models, together with 10-15% of new code that contains algorithms which produce a higher percentage of winning trades).
If the information that you have available for any model is not enough
to satisfy the conditions above, you should NOT use that model.
On the other hand, it you can evaluate a model as above,
you most likely do not need any other info !!!
Friday, September 22 2017
ABSOLUTELY NOT !!!
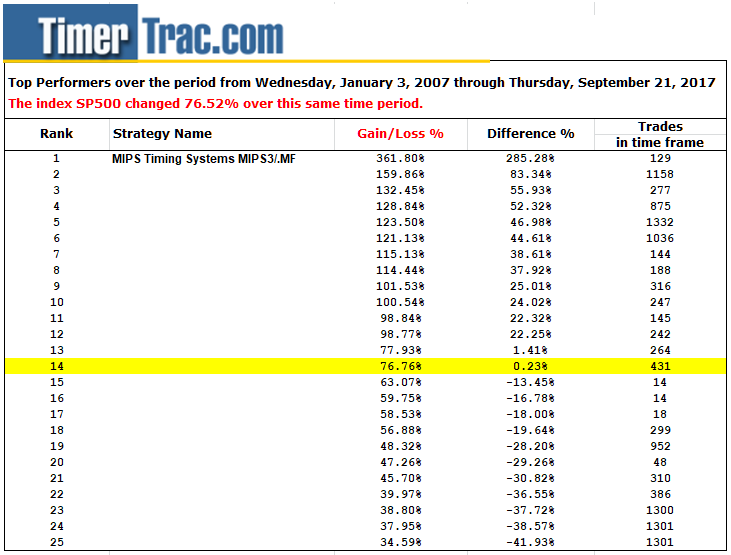
The table below shows the ranking of the top 25 models that TimerTrac.com tracked in the period of
2007 - 2017 ytd. MIPS3/MF is the #1 Ranked model out of the top 25.
Please note that the performance of these models is NOT correlated to the number of trades they issued.
For Example:
MIPS traded about 130 times in this 10-year period and was the #1 Ranked model with a gain of 362%, whereas the #25 Ranked model traded 1,300 times and was only up 35% !!!
Saturday, September 16 2017
We all know that the current up-trend in the SPY has been strong since Mar'16. There might be a slight degree of degradation at this time, but not much.
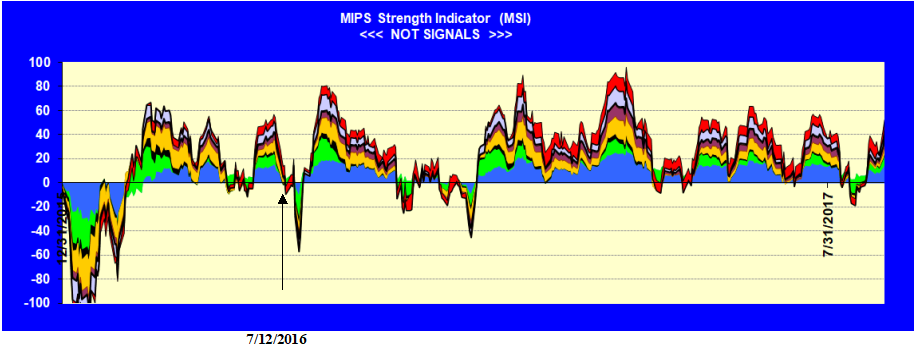
Of course, MIPS remains relatively positive
- see the MIPS Strength Indicator (MSI) immediately below.
- this is a combo of some of the best MIPS technical indicators and math algorithms.
- the black arrow from the bottom on 7/12/2017 identifies the last trade for some of the MIPS models.
Here is what today's trend looks like from a technical perspective.

Note: Almost perfect, low volatility "Up -Trending' EMAs (50-100-150-200-Day EMAs)
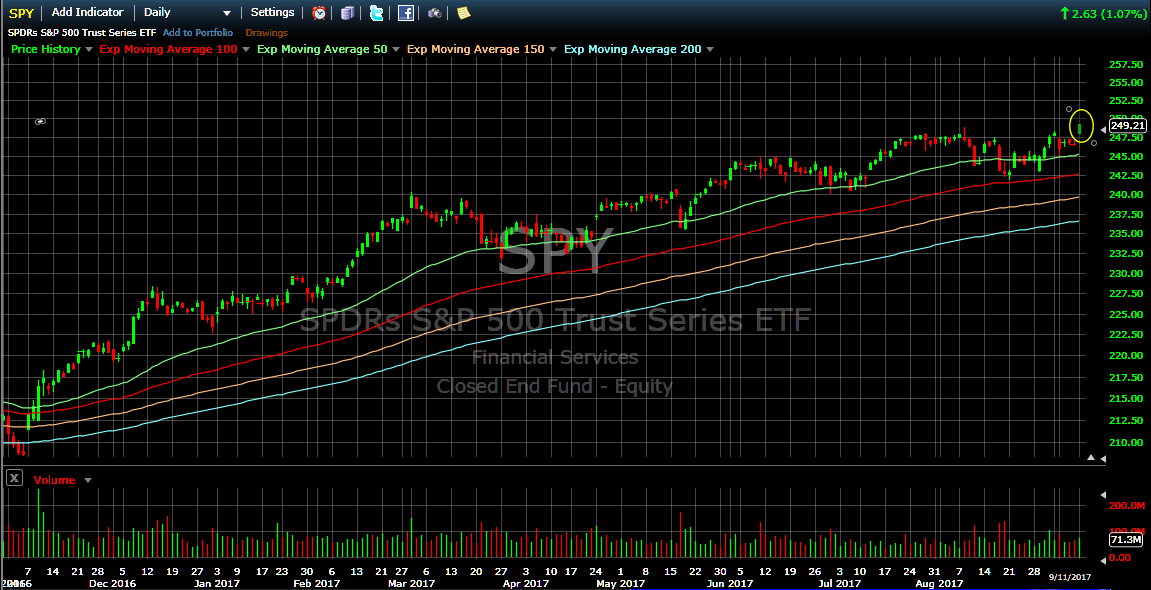
Monday, September 11 2017
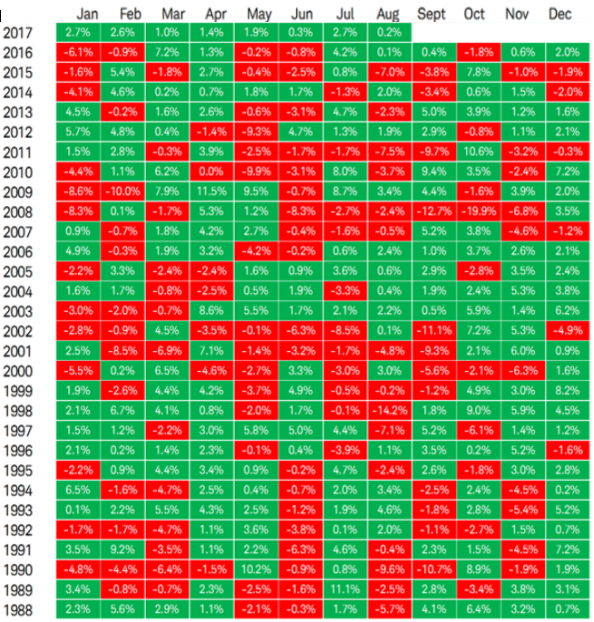
FYI - Stocks have not been rallying for the last 10-16 months in the USA alone.
The current trend in the S&P 500 has been up for a relatively long time. But it is not alone. The MSCI All-Cap World Index (ACWI) has been up EVERY MONTH for the last ten months (and for 13 of the last 14 months). This is the first time in its 30-year history that a rally in this Index has been this perfect for so long. See the Table immediately below.
We all know that the current trend in the SPY has been strong since 3Q'16, and continues to be at this time. When a potential war with N. Korea, multiple record-breaking destructive hurricanes, a severely divided country and Congress, etc., is not enough to "turn a trend", then almost by definition, that trend must be strong.
Here is what today's trend looks like from a technical perspective.
Note: Almost perfect, low volatility "Up -Trending" EMAs (50-100-150-200-Day EMAs)
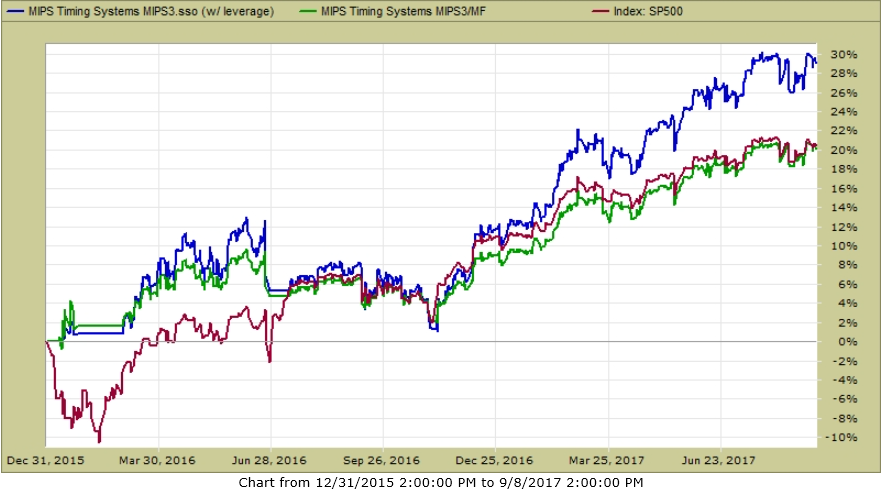
So, how has MIPS performed in the time period?
MIPS is doing a great job of not getting "sucked in" to the little dips over the last 18 months and has produced excellent results.
2016 - 170908
Blue Line - MIPS3 1.5x Long / 0.5x Short +29.5%
Green Line - MIPS3 1.0 Long / 1.0x Short +20.5%
Red Line - SPY + 2.5%
(From Timer-Trac.com)
Paul Distefano, PhD
MIPS Timing Systems, LLC
Houston, TX
281-251-MIPS(6477)
Sunday, August 20 2017
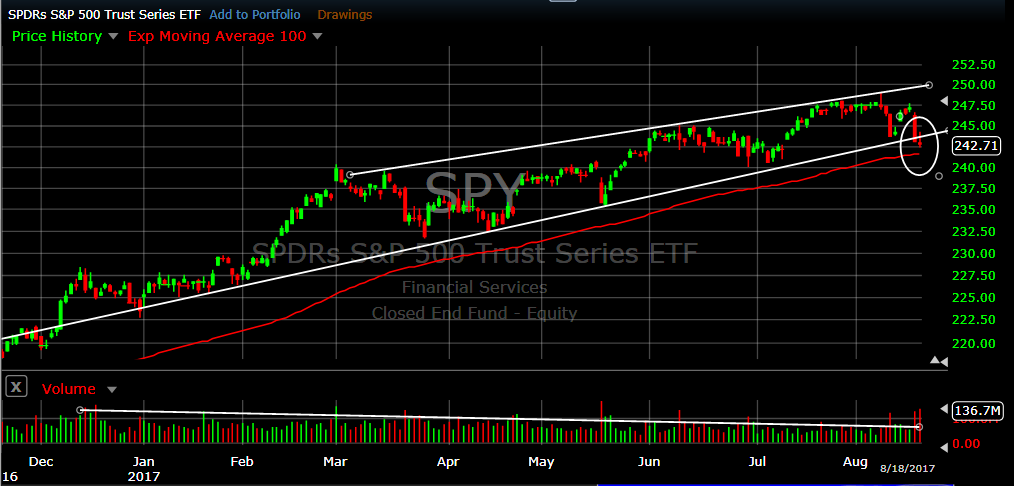
Some "Traders" (mainly day-traders) are panicking because the market (the SPY) has fallen 2.2% in the last few days, and they should be. "Investors", like us at MIPS however, should not be shook by a 2.2% drop following a 18.9% gain on the current signal.
BTW, the MIPS models have some degree of relativity built-in so that, under some conditions, the models will consider a 2.2% drop on a 18.9% gain worthy to analyze closely, but not enough to run for the hills. On the other hand, had the 2.2% drop occurred after only after like a 4.1% gain, the MIPS models would most likely have gone short by now.
See the chart below:
1) The MIPS4 model has been long since 7/12/17 and had gained 18.9% by 8/08/17; only to
lose back 2.2% of this gain by 8/18/17 (net YTD gain of approximately +16.7%).
2) The SPY broke its trend line slightly by 8/18/17; but closed above its 90-day EMA (red line).
We all know that the market can move in any direction from here, so look out for Signal Change emails from MIPS, and check the "Current Signals" at http://www.mipstiming.com/signals_results
Paul Distefano, PhD
MIPS Timing Systems, LLC
Houston, TX
281-251-MIPS(6477)
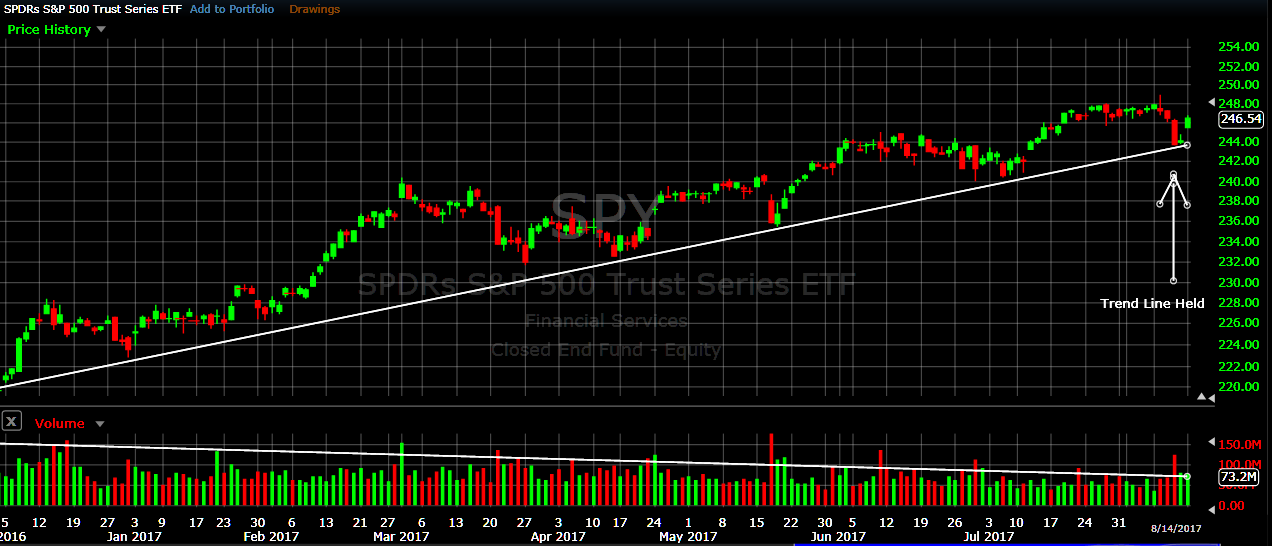
Monday, August 14 2017
Remember, "The trend is your friend" !!!
The market (S&P500 ETF SPY), held its trendline last week and bounced off its trend to the upside today.
- holding above the trend is very bullish, but
- ever decreasing volume is slightly bearish.
Don't fight the Trend...
- MIPS Members can see what MIPS did at http://www.mipstiming.com/current_signals
Paul Distefano, PhD
MIPS Timing Systems, LLC
Houston, TX
281-251-MIPS(6477)
=============================================================
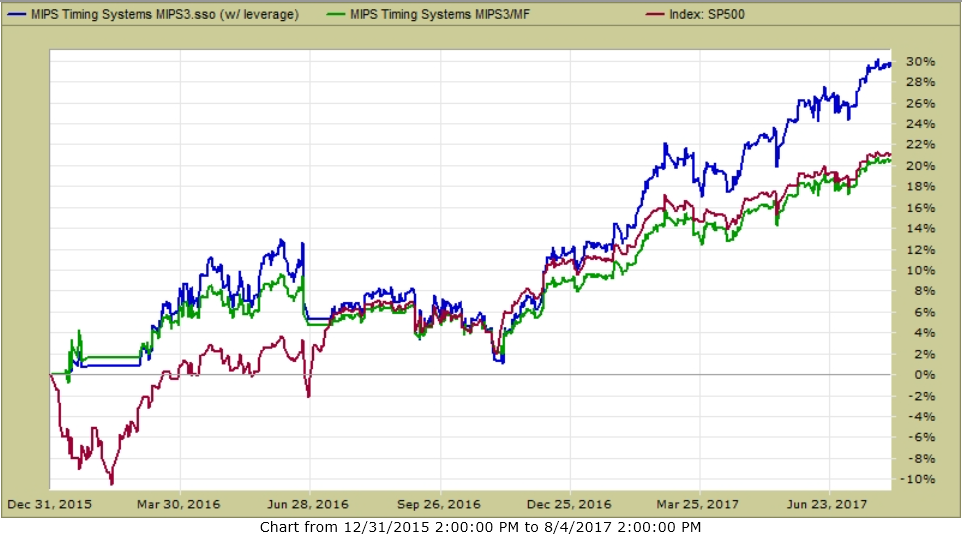
<<< Blog from 8/06/2017 >>>
MIPS Members:
The long-term market trend is UP, and in up markets almost every investor has been told "don't fight the trend". But, of course, all trends come to an end, and that is what leads to market cycles and even market crashes. This upside trend has lasted for well over a year, with historically low volatility, and may be ready for at least a correction. See the graph below for the market (SPY) movements over the last 9 months.
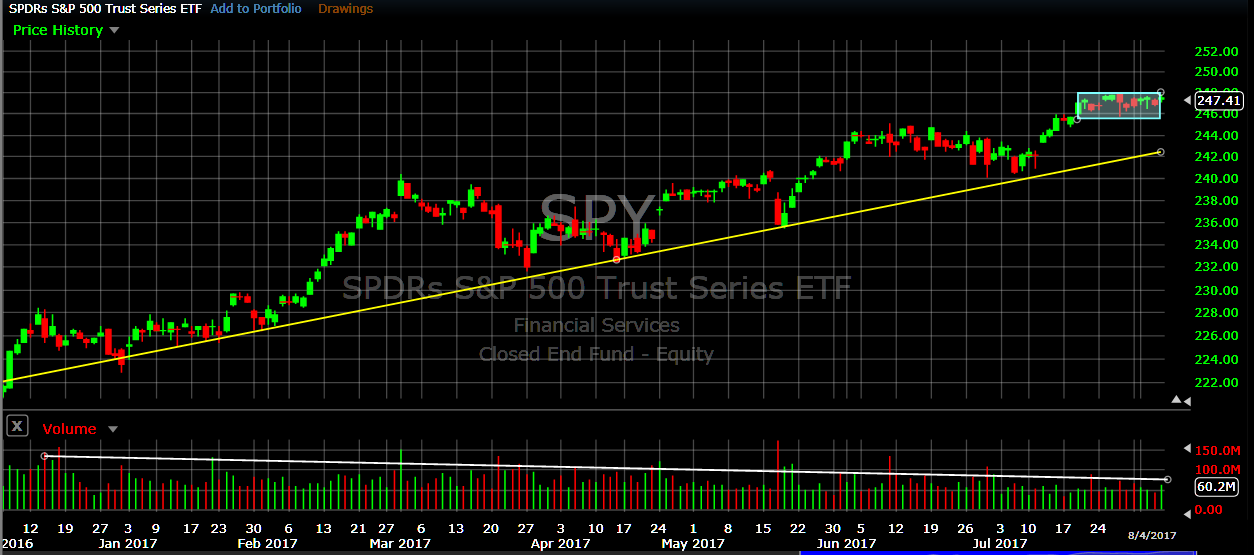
It can be seen above that the market has followed a near-perfect uptrend, with higher highs and higher lows. However, the daily volume in this time period has dropped nearly 40%, and this is not a good sign from the Big Guys.
MIPS xRay View
And, in the last couple of weeks, the market seems to be flattening-out. For this, let's "zoom-in" and go into our xRay view to see an example of what's going on under the skin in a certain part of the MIPS models (see graph immediately below).
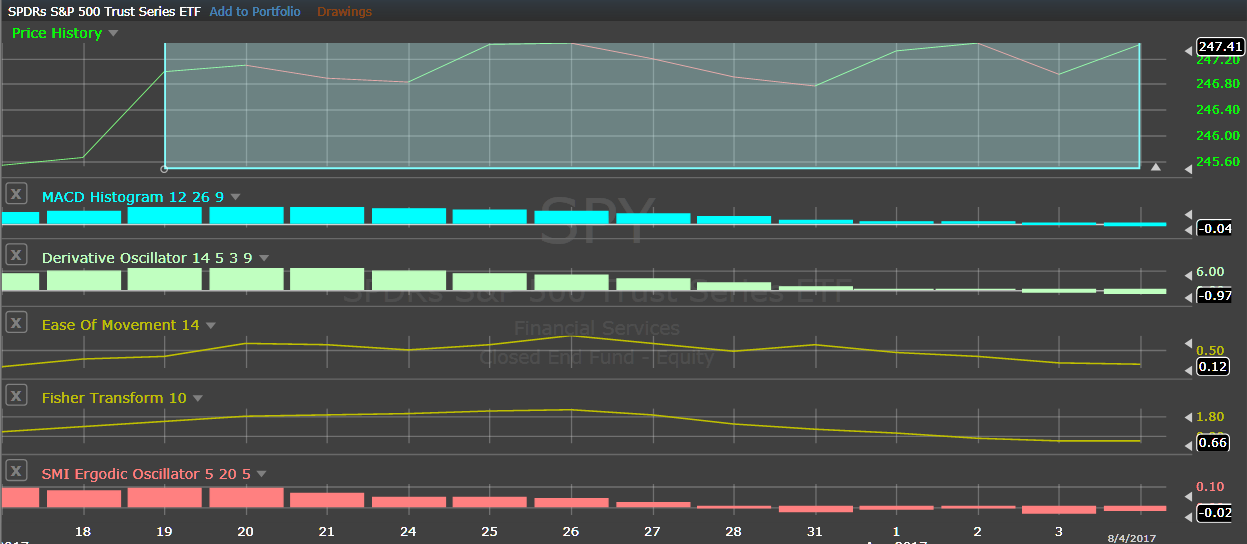
When we take the volatility out of the price action of the SPY over the last two weeks as done above, we see that the market closes have indeed been VERY flat. From this, one might expect that the indicators in the MIPS models are also flat (like not moving up or down). In actuality, you can see that ALL of the five indicators above are decaying from positive to negative (or close to zero). This could indicate that the uptrend is decaying. Of course, this is a VERY small part of a MIPS model (5 out of over 150 indicators and lots of math), and other parts of the models are signaling that the market still has steam. For example, see the MIPS Market Strength Indicator (MSI) below.
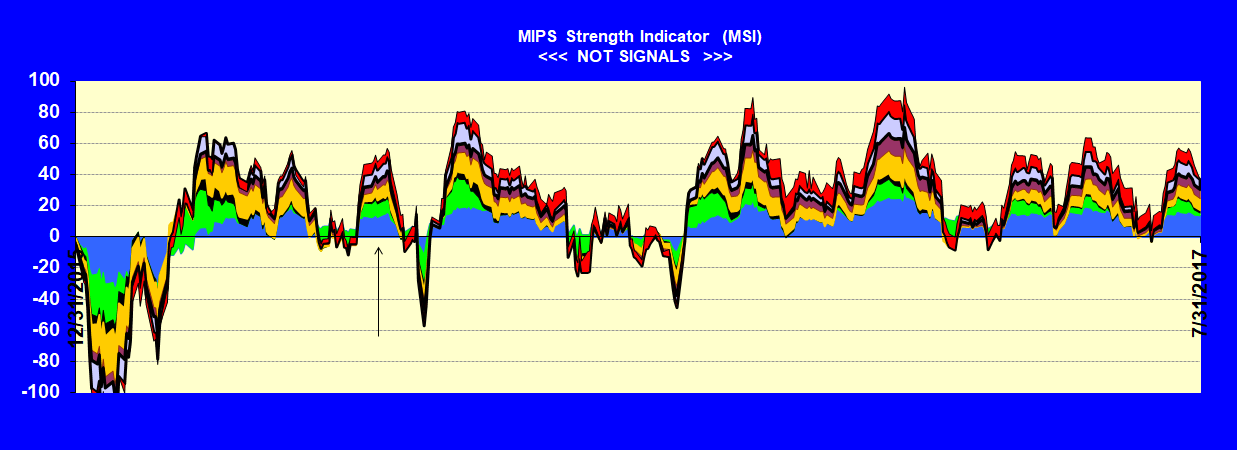
MIPS Market Strength Indicator (MSI)
The MSI graph below shows the relative strength of 8 of our best indicators. These are showing a neutral to positive view of the market direction at this time, and never went seriously negative since early 2016.
.
MIPS3 Performance 2016-2017 YTD
All of the MIPS models are still Long, and the performance since 2016 has been very good.
Of course, we will continue with the Long signal from MIPS until MIPS changes its mind.
MIPS3 - 2016 - 08/04/2017
(Trading SPY Long / Short)
Blue Line 1.5x Long / 0.5x Short +30.0%
Green Line 1.0 x Long / 1.0x Short +20.5%
MIPS3 in 2008
And, don't forget how MIPS3 did between Oct'07 and Mar'09 (see graph below).
SPY -50% MIPS3 +108%

CONCLUSION:
MIPS's position is that the market still has an upward bias, and we expect more growth from this market. But, MIPS is seeing some aspects of a neutral or decaying trend. From the above, you can see that MIPS is doing whatever it needs do to to ascertain when the market is going south, and then getting us out. This is the time when you make big bucks using good timing models, like MIPS3 and MIPS4.
Stay tuned...
Best Wishes !!!
Paul Distefano, PhD
MIPS Timing Systems, LLC
Houston, TX
281-251-MIPS(6477)
|


 .
. 


