|
As you look at the two graphs below, you will see either of:
1) Another Trading Range as in Chart #1, or
2) A New Up-Channel as in Chart #2.
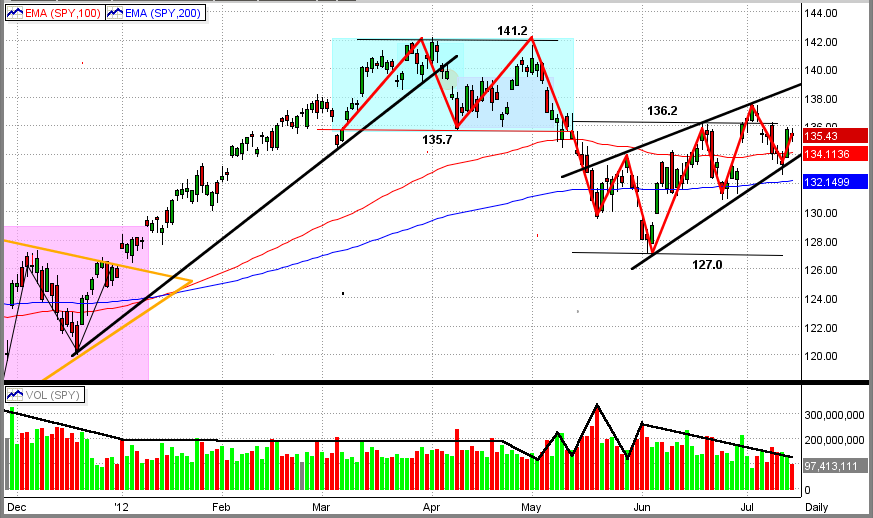
Chart #1 - Another trading range, with up-side resistance at 136.2 and downside support at 127.0
- If the SPY breaks thru 136.2 to the upside, we should have a rally
- But, if the SPY fails to break up above 136.2 over the next few days, the SPY will most likely
fall back to 127.0
Chart #1

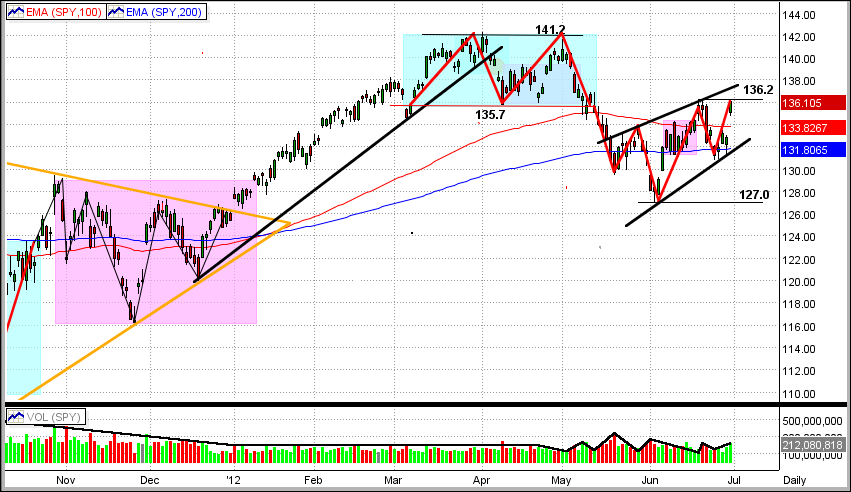
Chart #2 - An Up-Channel, with higher highs and higher lows
- This market is definitely trending up, so the question really is: "Is this truly a new up-channel?"
- The SPY has been bouncing between 127 and 136 for all of 2012, so it's time the market finds a new trend
- The chart below seems to be indicating that its new direction will be up, but it could easily continue sideways
- So, let's let MIPS tell us what to do and when.
Chart #2
|