Friday, March 21 2014
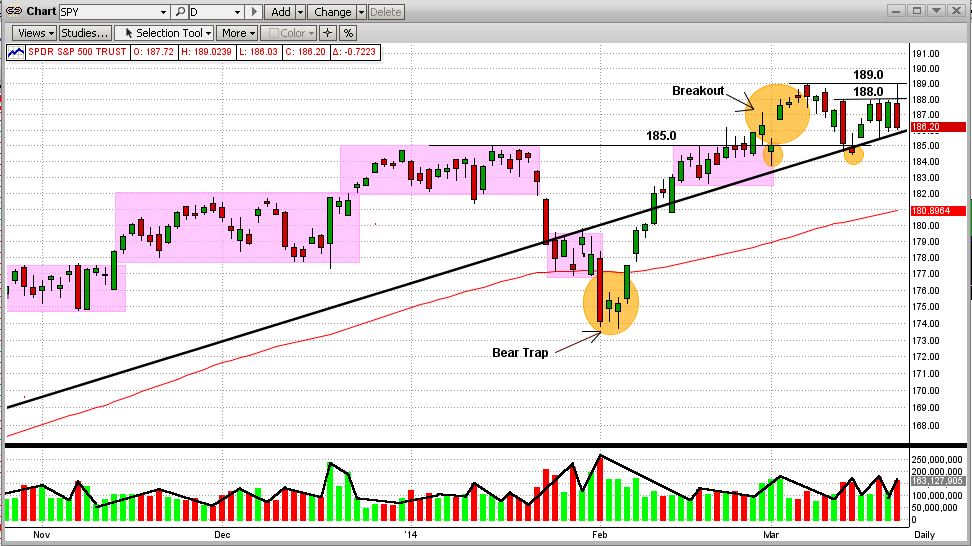
The SPY proved today (March 21) that the market's "Stone Wall" that has prevented it from surpassing its all-time high is still there.
To see this plainly, please look at Graph #1 below:
1) The SPY hit its all-time high at $189 on 3/07/2014.
2) Then it trickled down for a few days followed by a big drop on 3/13/2014.
3) The SPY bounced back on the intersection of its trendline and support level at $185.
4) This uptick met an abrupt halt at $188, exactly where the big drop started several days before.
5) Since then, the SPY has tried and failed 3 more times to break above this "Stone Wall" at $188.
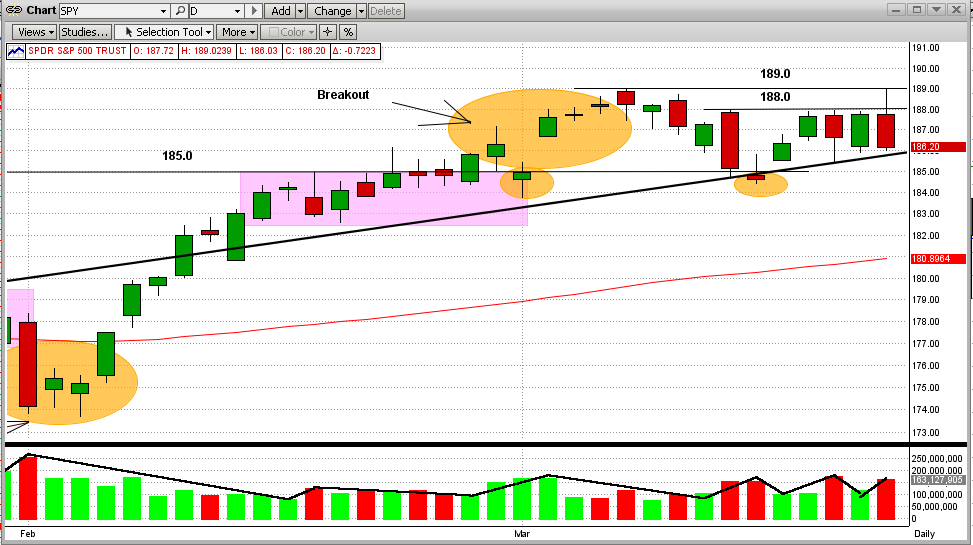
6) In fact, early today the SPY did pierce this level and climbed all the way to the all-time high level at $189,
only to be slapped all the way back down to the low of the day at $186.2 (see the 2nd Graph below).
7) The volume on down days was higher than on up days (bearish, but certainly not conclusive).
These movements in the SPY are more pronounced in Graph #2 below
Graph #1
In Graph #2 below, the SPY now appears to be in an "Reverse Pennant" or "Widening Wedge" pattern, either or both of which could prove to be bearish. As we all know by now, there are plenty of reasons why this market should have had a correction by now and really only one big reason why it should continue to climb higher. However, the one big reason (the Fed) is starting to lose traction.
It's anybody's guess where the market will move from here. But MIPS does not guess, it calculates all the likely options and chooses the one with the highest probably. And, it almost always beats my guesses.
Graph #2
Tuesday, March 18 2014
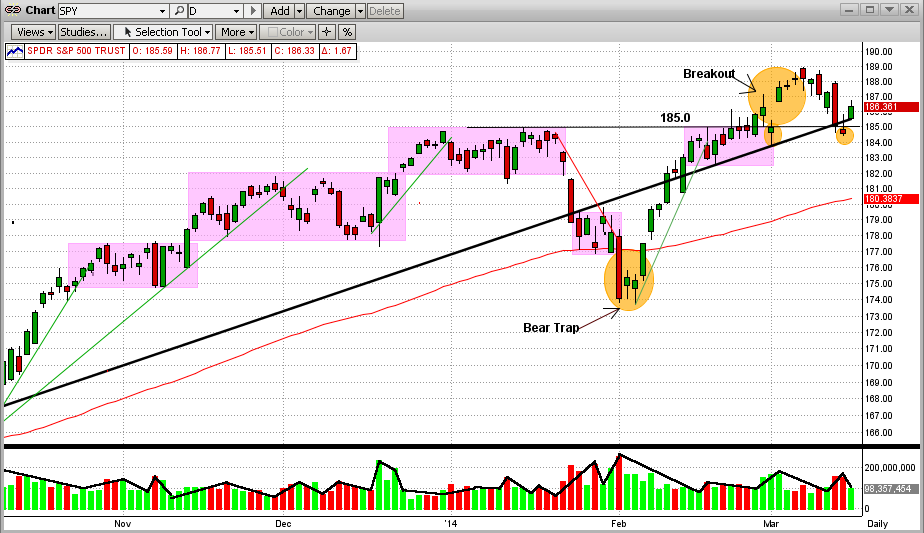
In our blog from March 4, 2014 below, we stated that we believed that the market (the SPY) had confirmed its breakout above its previous all-time high (and strong resistance level) of $185 per share on 2/27/2014. Of course, on that day its upside "resistance" at $185 immediately became its downside "support" level.
In that blog, we also went on to say that: "Most likely, the SPY will come back down to test this new $185 support level and the SPY must 'hold the line' there for this 'breakout' to be real and lasting."
And, that is exactly what the SPY did last week. As can be seen in the graph immediately below, after the SPY reached new highs, it dropped back down over 6 days and actually closed a little below its strong support at $185 (which now looks like a typical "bear trap"). Today the SPY rallied and closed at $186.33/share, thus technically again confirming the previous breakout. Now, the new upside resistance for the SPY is at about $188/share and the new downside support is at about $184.5/share. The next support level is the 50-day EMA, which is now at $183.4/share. It is important to notice that:
1) the two "pullbacks" in the last few weeks did not break the SPY's long-term trendline,
2) since MIPS does not follow "wiggles", the MIPS models did not get sucked into costly short calls, and
3) the volume on today's uptick was on healthy, but not high, volume.
All things considered, and from a purely technical standpoint, the market appears to be poised for more upside. But, there are many reasons why the market could pull back sharply (like the situation in the Ukraine, amongst may others). So, instead of trying to "guess" with our hard earned money which way the market will go from here, let's let MIPS do the heavy lifting and tell us what to do.
Paul Distefano, PhD
CEO/Founder
MIPS Timing Systems, LLC
Houston, TX
281-251-MIPS(6477)
<<< Previous Blog >>>
3/04/2014
MIPS Members:
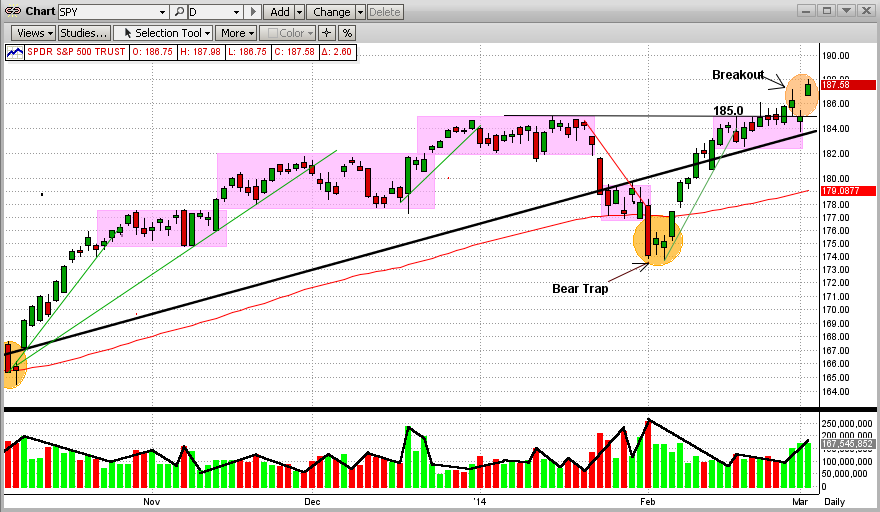
In our previous Blog below, we showed a breakout of the SPY above its all-time high level of $185 on 2/27/2014 (Thursday) and a confirmation of this breakout on Friday. After a single day of dealing with Putin's ego on Monday (SPY back down to close a fraction below $185), the SPY bounced back up today to $187.85 (new high). And, it was very comforting to see higher volume on the up days (see graph immediately below).
All of this is good news for the bulls. The market should push even higher in the short-term (weeks/months). For this to actually happen, however, we need to see continuing higher levels for the SPY from here or at least several solid days above $185. Most likely, the SPY will come back down to test this new $185 support level and the SPY must "hold the line" there for this "breakout" to be real and lasting.
Still, its anybody's guess. To our benefit, we have MIPS to tell us what to do (all MIPS models are still long).
Tuesday, March 04 2014
In our previous Blog below, we showed a breakout of the SPY above its all-time high level of $185 on 2/27/2013 (Thursday) and a confirmation of this breakout on Friday. After a single day of dealing with Putin's ego on Monday (SPY back down to close a fraction below $185), the SPY bounced back up today to $187.85 (new high). And, it was very comforting to see higher volume on the up days (see graph immediately below).
All of this is good news for the bulls. The market should push even higher in the short-term (weeks/months). For this to actually happen, however, we need to see continuing higher levels for the SPY from here or at least several solid days above $185. Most likely, the SPY will come back down to test this new $185 support level and the SPY must "hold the line" there for this "breakout" to be real and lasting.
Still, its anybody's guess. To our benefit, we have MIPS to tell us what to do (all MIPS models are still long).

<<< Previous Blog >>>
MIPS Members:
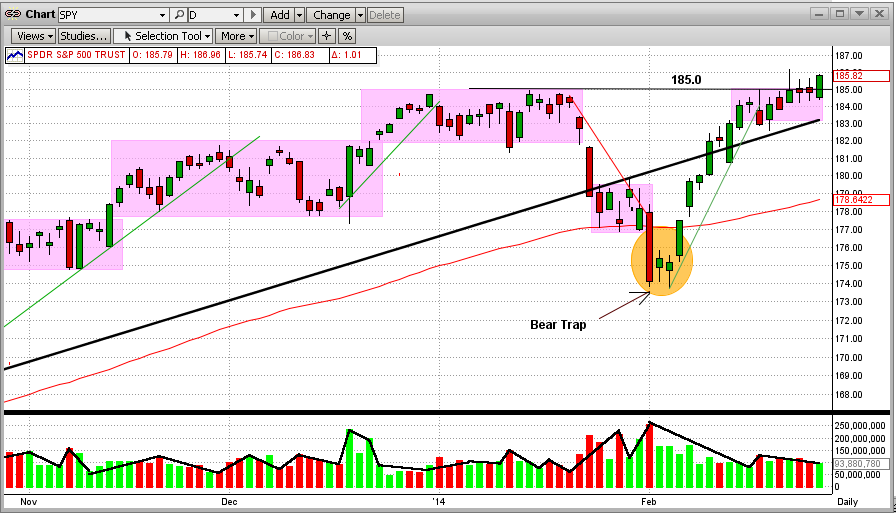
After the SPY hit or broke its all-time high resistance level at $185 for the last 5 of 6 days and got slapped back each time, it finally broke out above that level on 2/27/2013 (see graph immediately below). Although the breakout was not dramatic (no gaps, no extremely high volume, etc), it was a classic breakout. The SPY opened lower than the previous day's close, and steadily climbed all the way to $185.82 on the close on Thursday.
From this, one would expect the market to climb from here. So far on Friday (10:15 am CST), all of the major indices are up (with the SPY up +0.5%). For how long and how high this continues, we will have to wait and see. All of the MIPS models are still long at this time.
<<< Previous Blog >>>
MIPS Members:
In our previous blog below, we pointed out how the SPY had made a dramatic change in direction in the first week of Feb'14, and turned up in what seemed to be a powerful uptrend. But, the uptrend lacked strong momentum due to the low volume in this uptrend. In other words, the uptrend was the result of buying by the little guys and was NOT joined by the fat kats.
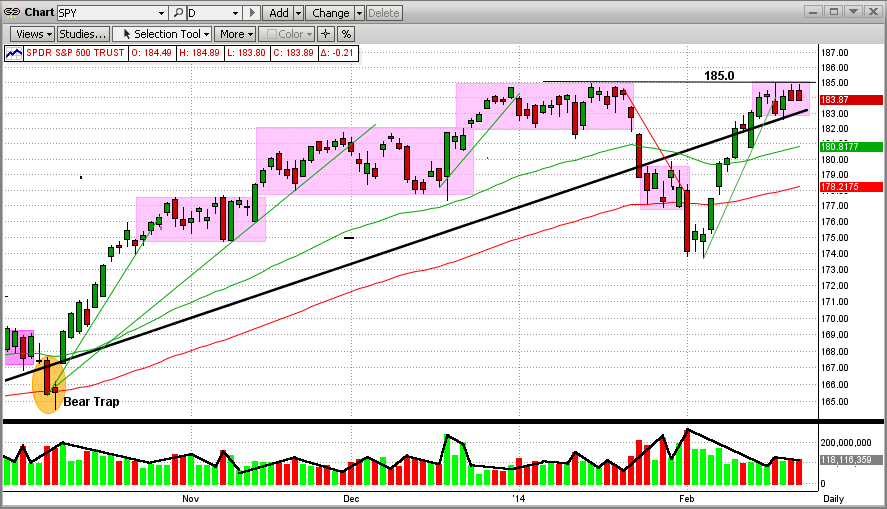
So, what has happened since then? The SPY uptrend hit what I call a chartist's "stone wall" at its previous all-time high of 185.0 (see chart immediately below). And, by the way, the SPY tried to break through 185.0 in 3 of the last 4 trading days, only to be slapped back at exactly 185 all 3 times. The little guys could not push the SPY through the 185.0 resistance level all by themselves. And, they will not try this alone much longer. My opinion is that, if this market gets some support from the fat kats, the SPY will continue up to new highs. But with the little guys alone, it cannot. The SPY volume levels will be high on my radar screen next week.
And, of course, if the little guys give up or the fat kats go against them, the SPY will most likely fall back to its support level at 174, or below.
It's so good to put the decision of what to do on the shoulders of the MIPS models so we can sleep at night. Let's wait for MIPS to tell us what to do, and when.
|