Some investors (including some MIPS members) seem to think that when there is not a position change (Signal Change) in a MIPS model for a long period of time, they are being ignored or something is wrong with the model that they are following. They can't seem to understand that a good model (like MIPS) only changes position when the market changes its behavior, and that change is detected by the model. With MIPS, this would be when the intermediate-term market "trend" changes direction. We at MIPS input data and run our models daily (in triplicate), independent of whether or not there is a change of any type.
All daily model developers (including MIPS) provide their subscribers with "Investment Positions" (Long or Short or Cash) about 250 days every year (52 weeks/year x 5 trading days/week - holidays). This is not a function of how often their models trade.
There is, however, a big difference in how these "Investment Positions" are reported amongst model developers (aka Signal Providers):
1) Some Signal Providers send out emails to subscribers with current positions every trading day, whether or not the signal has changed. Many subscribers do not like this because they get inundated with emails from their Signal Provider and many times they miss a "signal change" due to confusion or boredom.
2) Other Signal Providers only send out emails to subscribers when there is a change in position from their model. Subscribers don't like this because there can be long periods of time (weeks/months) when they don't hear from their Signal Provider, and hence they are not 100% sure that they did not miss a signal change somewhere along the way or that the Signal Provider is now inactive.
3) At MIPS (as with most other good Signal Providers), we send out
(a) A "Signal Change" email the very day that one of our models calls for a change in position
(Long-to-Short or Short-to-Cash or etc.)
(b) A "Signal Status" email every weekend showing the current position for all MIPS models.
Our subscribers like this because the "Signal Status" tells them if they are in the correct
position at that time.
The moral of this story is that MIPS runs its models each and every day, no matter what the market is doing. This includes the status and behavior of hundreds of technical indicators and mathematical equations, and thousands of calculations. it is NOT any easier to run the model when the current signal remains the same or when there is a signal change.
We report the results to you every time there is a Signal Change, with instructions on our website for you NOT to change this new position until there is another Signal Change issued by the MIPS model that you are trading with. In the meantime, we keep you up-to-date on the Signal Status for each MIPS model every weekend, in case you accidentally did not act on the latest Signal Change during the week.
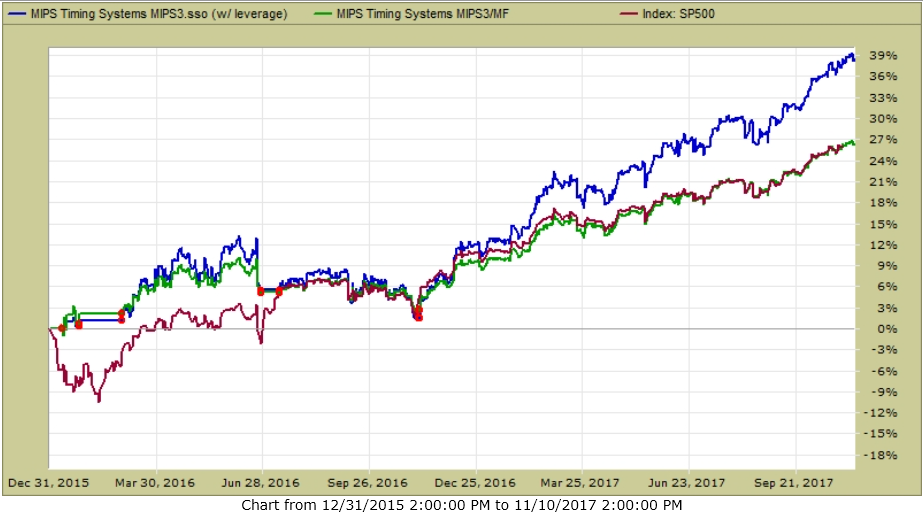
Here are the trades (red dots) and performance of the MIPS3 model since 2016
Blue Line - MIPS3 1.5x Long / 0.5x Short +39%
Green Line - MIPS3 1.0x Long / 1.0x Short +27%
Red Line - SPY........................................... +27%
Red dots show actual trades

As you can see in the graph above, the last trade was in Nov 2016, and the trend has been very
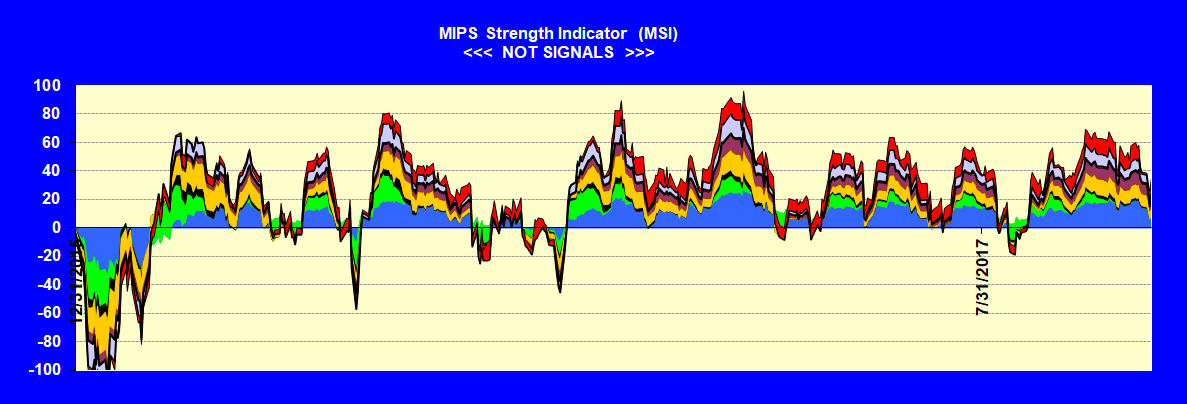
consistent since then. In the graph below, you can see that the MIPS Strength Indicator shows little or no weakness (until last week).

Best Wishes...
Paul Distefano, PhD
MIPS Timing Systems, LLC
Houston, TX
281-251-MIPS(6477)