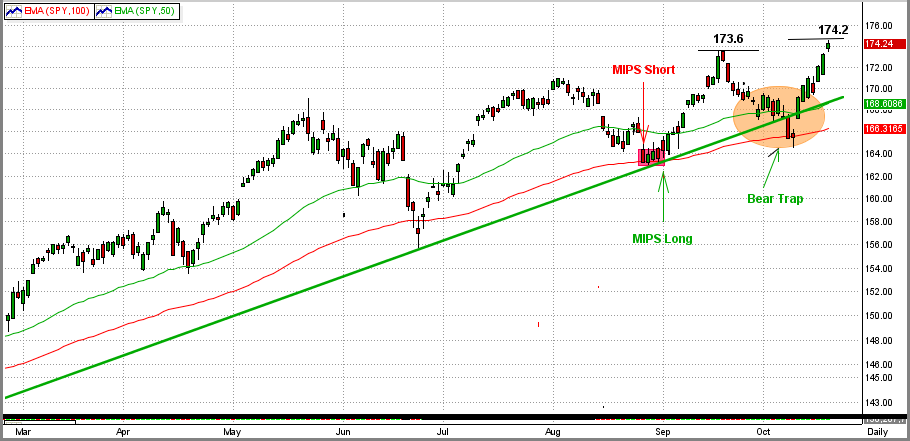
Whether it is the sequester, Fed tapering, debt limit fiasco, etc., the market in 2013 has been volatile. But, it has remained mainly in an identifiable up-trend. During this time, however, the market has had enough major "dips" to drive some market timing systems crazy. But, the MIPS models have remained Long for almost the entire year.
The last several months have been illustrative of this, and show that the MIPS models have not gotten "fooled" into costly short signals. For example, the MIPS models have been long since 9/3/13 (after a 6-day, nondescript "short" on 8/27/13). In other words, the MIPS models have ignored the recent Bear Trap in the graph below by staying Long, and have, hence, "dodged a bullet".

Many MIPS members are worried about the Market Crash of 2014, and wonder how MIPS will handle it.
Some timing systems have traded 15-25 times in 2013 and many have gotten whipsawed. In 2013, the MIPS models have been Long for the majority of the year, but are lagging the SPY by about 5%. Others have not traded at all and have "matched" the market. The problem with timing systems is that some do very well in up-markets and many of these do terribly in down markets, and vice-versa.
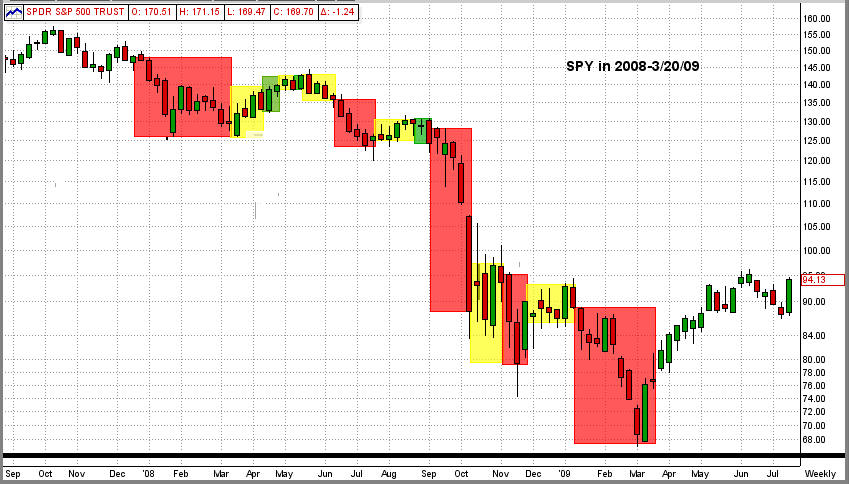
So, how does MIPS do in down markets? Our best example of this is in the year of 2008. The graph below shows the Long/Short/Cash Signals from our MIPS3/MF model in the time period 2008-3/20/09 (verified by TimerTrac).
Just how did MIPS3/MF handle the BIG market crash of 2008?
- well, it started with a short call on 12/12/07 for a 12% gain, followed by 4 other profitable short trades.
- for example, the total gain on the last 3 short trades between Sep'08-Mar'09 was about +40% !!!
This gives me great comfort and confidence in MIPS to get us out and to MAKE MONEY is the next CRASH !!
Legend: Red Box = Short Signals; Green = Long Signals; Yellow = Cash
