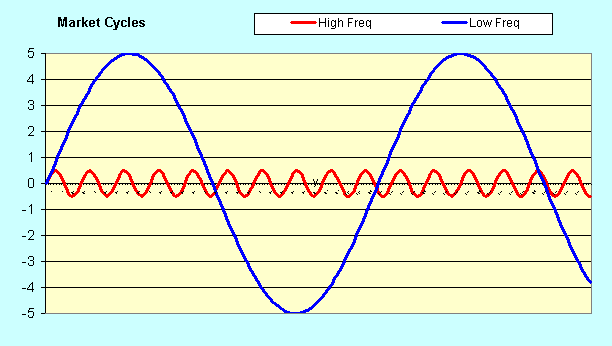
All financial institutions, stock market traders, professional financial advisors, and most individual investors know that the stock market moves in waves (or stock market cycles). In mathematical terms, a wave's "cycle" is when the wave completes a move from going up to going down, and then to going back up to its starting point; and the "frequency" is how long it takes to complete that cycle.
Stock market cycles vary from "very long-term" to "very short-term," where very long-term could be 10 years or more, and very short-term could be as fast as daily. See the sample graph below.
Long-Term Cycles (yearly waves)
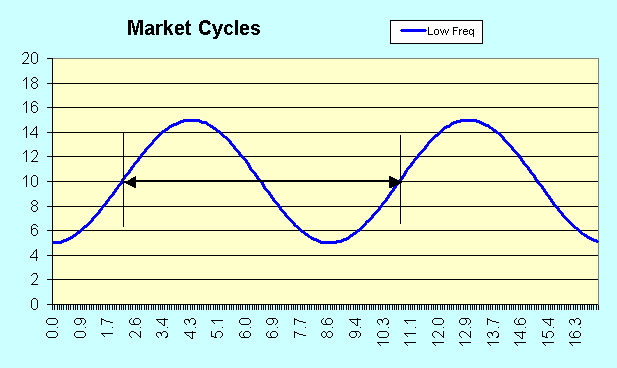
In general, the stock market goes up for 4-5 years and then crashes in the following 1-3 years. Let's say then that (on average) the stock market goes up for about 5 years and then crashes over the next 2 years. When looking at multiple cycles of this type (see below), you can clearly see the repeating 7-year cycles.
The exact point in time when these cycles hit their peak and turn down AND where they bottom out and turn up are called "Inflection Points" and this is what every investor wants to identify. This is the stock market cycle timing we look for. The behavior of the slope (or tangent) of the curve over time is a good indicator of the direction of the curve (i.e., up or down trending). In fact, the slope of the curve at the inflection point is zero. This is used for timing stock market cycles. Click here for an illustration
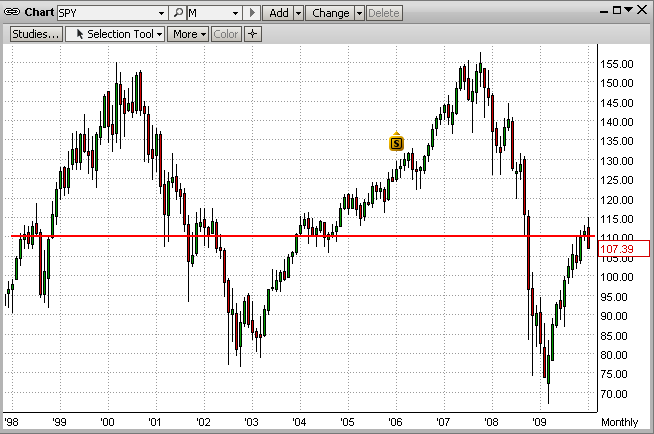
For an example of this in the real world, please refer to the graph below for the actual performance of the stock market from 1/2/98 to 12/31/09 (see real cycles withrepeating 7-year frequencies.)
Mid-Term Cycles (monthly waves)
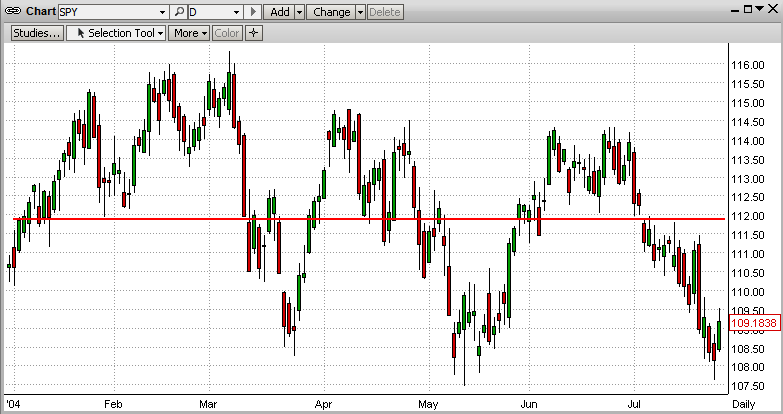
Looking carefully at the graph above, you will see that within the large up-to-down and down-to-up moves in the stock market, there are multiple periods where shorter frequency cycles are occurring. For an example of this, look at the period between Jan'04 and mid-July'04 in the graph below. From this, you can see "monthly" stock trading cycles occurring.
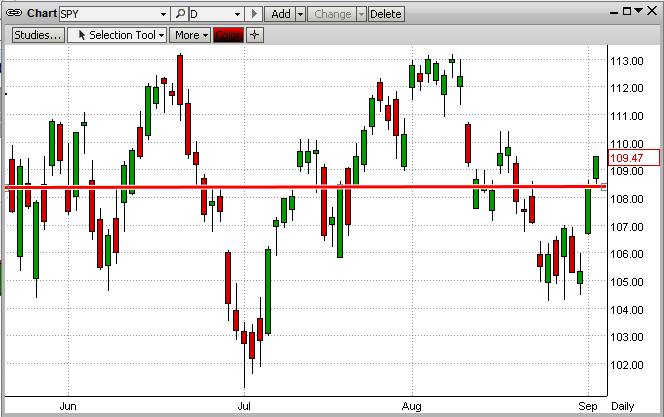
Short-Term Cycles (daily waves)
Drilling down a little deeper, we can see daily trading cycles. For example, please refer to the graph below for daily cycles in the 90-day period between 5/19/10 and 8/19/10. Again, you will notice that there are multiple waves within this 90-day time period.
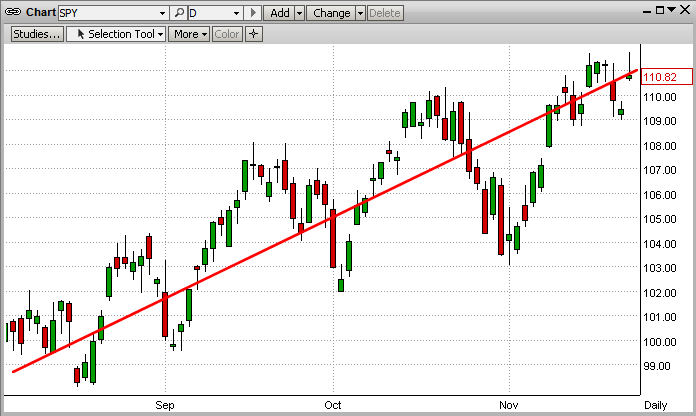
Up Cycles
NOTE: The above cycles are easy to see and illustrate in sideways markets, but the stock market does exactly the same thing in up-trending and down-trending markets (i.e., the market also moves in cycles on the way up and on the way down). See below.
We could continue this analysis all the way down to minute-by-minute cycles, but by now you most likely have the point and drilling down further is not necessary.