We received a of lot questions in the last few days from MIPS members wanting to know what was MIPS assessment of the market (SP500 or SPY). Unless we would do an extensive, several day analysis of the internals of the MIPS models, we really can't honestly answer that question.
But, we have developed a "tool" that does just that, and it is available to MIPS members only. We call it the MIPS Market Strength Indicator (MSI) and it has been on our website for over one year. Recently, we improved the MSI, took it off of the front page, and made it available to MIPS members only. A "sample" MSI is still on our homepage for illustrative purposes, but it is delayed by 30 days or more.
You can access the up-to-date MSI by clicking on the link => http://www.mipstiming.com/msi___mips_members
- at the bottom of this email, we show you where to find this link on our homepage.
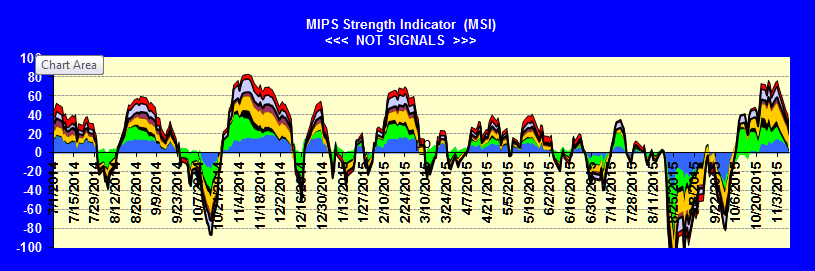
The MSI consists of several of our most accurate indicators. Hence, the MSI shows things like the relative strength of the market on a scale of -100 to +100. It aslo shows if the market is getting stronger (up-slope) or weaker (down-slope), etc. But it is NOT accurate enough to trade with.
The MSI can be compared to the "Vital Signs" charts that are available to physicians who "make the rounds" of their patients in a hospital. This Vital Signs Chart shows "indicators" of each patient's medical status, like their temperature, blood pressure, heart rate, etc. If any of these look bad, their physician will most likely dig deeper (like put them on medical alert, order more tests, etc.).
Today's up-to-date MSI looks like that immediately below. This chart tells me that the MSI sees the market as being very weak and one that could go anywhere from here.
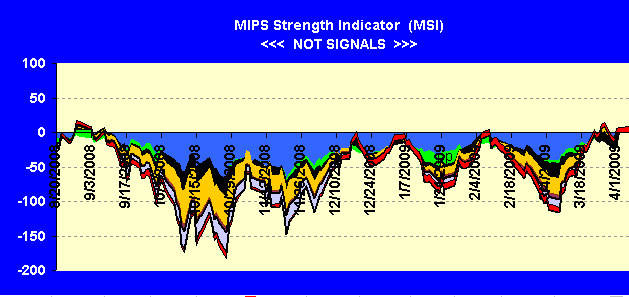
BEAR MARKET (from Sept'08 - Apr'09)
Does the little "dip" recently (in the graph above) constitute the beginning of a bear market ???
If you are surprised at the answer below, you most likely have never seen a bear market from the eyes of technical indicators. To help with that, we went back to 2008-09 and recreated the MSI. Surprised at the outcome ???
When you see this again (most likely sometime this year) MIPS should be short and we should be making money hand-over-fist.
Another little secret. When the bear comes, he comes fast, wreaks havoc, and NEVER lets up. Therefore, MIPS is almost never tempted to join a "fake" up-trend in a market crash, because there are NOT many to be found.
HOW TO ACCESS THE UP-TO-DATE MSI
MIPS Members can gain access to the current MSI graph by clicking on the "Up-To-Date" link in the MSI window on our homepage (see immediately below).
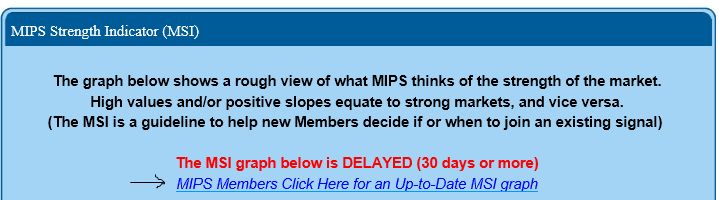
------> http://www.mipstiming.com/msi___mips_members


