First off, let us explain what MIPS Timing Systems means by "the market" as far as our investors are concerned.To most of us, "the market" is represented by an established stock market index like the Dow Jones Industrial average ("the Dow") or the Standard & Poors 500 average ("the S&P 500").Since the S&P 500 is based on the largest 500 companies in the USA and the Dow is based on only 30 companies, we track the S&P 500 in all of our MIPS dialog and analysis.Also, we believe that performing analysis of the S&P 500 for our stock market timing system using the ETF SPY is basically identical to using the S&P 500 itself.BTW, an ETF is a closed-end mutual fund that is traded like a stock (Exchange Traded Fund) rather than like a conventional mutual fund that only "trades" on the close at the end of the day.
The 100 Year Dow and110 Year Market Crashes
This section is about stock market growth and crashes (stock market cycles) over the last 110 years (1900-2010) and the actual financial damage that these cycles inflicted on investors (several resulted in financial disaster).The essence of MIPS is to minimize the financial damage from these crashes when compared to a buy-and-hold strategy.
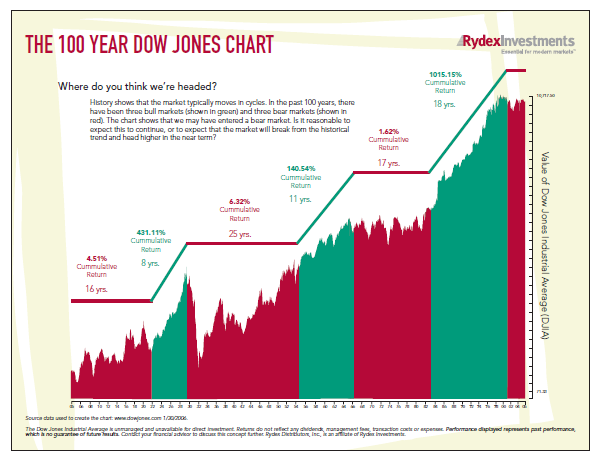
The first thing we need to review is the complete “stock market” performance (ups and downs, or bull markets and bear markets) over the last 110 years.The data for the Dow Jones Industrial Average (the “Dow”) is widely published all the way back to 1900 (before other market indices existed).There have been many changes to the Dow over that time period, and the Standard and Poor’s 500 Average is more representative of the “stock market.”But, the Dow data is accurate enough for us to make our point.
Under the "MIPS Basics" tab on our main menu, you will see how our stock market timing strategy can help investors better time the stock market to avoid the market crashes and to actually make money in these down markets just like hedge funds do.
Before we go forward, let me explain that the “scale” of the abovechart is a “logarithmic” scale rather than a “linear scale”. The logarithmic scale represents percentage differences between any two points rather than absolute differences of these points as it would be with a linear scale.Therefore, when the Dow compounds at a constant growth rate (say 10% a year), on a logarithmic scale this would show as a straight line; whereas on a linear scale, this would show as an exponential curve.
NOTICE:
Notice: The information provided on this stock market timing website is either solely the opinion of the company or is provided by our quantitative models, and is only for informational and reference purposes. Nothing on this website should be considered to be a recommendation to buy or sell securities. We are not financial advisors and do not offer investment advice. Our members should contact their financial advisors or accountants for said advice. Visitors must read and agree with our "Terms of Use" agreement and "Disclaimer" document prior to subscribing to our stock market timing service. DO NOT subscribe if you do not understand and agree with these documents. In addition to membership for individual investors we also offer a subscription plan for financial planners and certified financial advisors.
Most individual investors are taught to simply buy and hold, even in down markets. They are also told that (a) no one can time the market and (b) they should never consider short trades. And somehow, the SEC made it illegal for "retail" fund managers to execute short orders in their portfolios. But, everyone must have forgotten to tell the hedge fund managers this, as they have been making billions of dollars shorting the market for the last 35 years.
MIPS Timing Systems, LLC, was formed to provide stock market timing signals for individual investors to help them make money in both bull markets and bear markets like the high-profile professional money managers do (that is, like hedge fund managers that can trade long and short as they see fit).
The MIPS Timing Systems models analyze the stock market and provide information to our members when the models issue buy, short, and/or cash "signals". The MIPS trading system uses the S&P 500 Exchange Traded Fund (ETF), the SPY Index Fund, to represent the market and uses SPY in one of its index trading strategies. MIPS is not for high frequency online trading or for day traders.
Most of the information regarding the stock market direction provided herein is derived from quantitative models and mathematical algorithms owned and developed by MIPS Timing Systems, LLC. These are made up of numerous technical indicators, some of which are published and some of which were developed in-house. These technical indicators are looking for new stock market trends and the exact time that the market changes its trend line from up-to-down or vice versa (i.e., an "inflection point" in the stock market trend line). This provides our members with new tools for timing the stock market and to better manage their stock market investments.