Thursday, April 04 2019
The market (S&P500) in 1Q’19 was a relatively unique ride to the upside; and some of its main accomplishments were:
(1) completing the backside up-leg of a big V-Bottom,
(2) breaking the last topside resistance on the wat to a new all-time high,
(3) nearly breaking above its long-term trend, and
(4) performing as one of the top eight first quarters in the last 40 years.

In 1Q’19, there were many reasons “planted” by the press and newsletters about the market stalling and running out of steam. For example, the market took a big hit near the end on the quarter on the news that the yield curve had inverted (that is, the 3-month yield had surpassed the 10-year yield); and this is supposed to be an indicator that the USA is facing a recession. The day that “news” came out, the market took a big dive as many traders (and quantitative models) got sucked in. But, even though this “indicator” has a relatively good record at predicting recessions, these recessions are predicted to happen 6-24 months in the future, NOT now. And, we all know that THIS short-term yield came from decisions made by the Fed, NOT the overall economy.
Right now, and in the near future, I believe that US companies will do well and continue to grow at rates much higher than the last half of the last decade. And, when companies and their earning go up, their stock prices go up also.
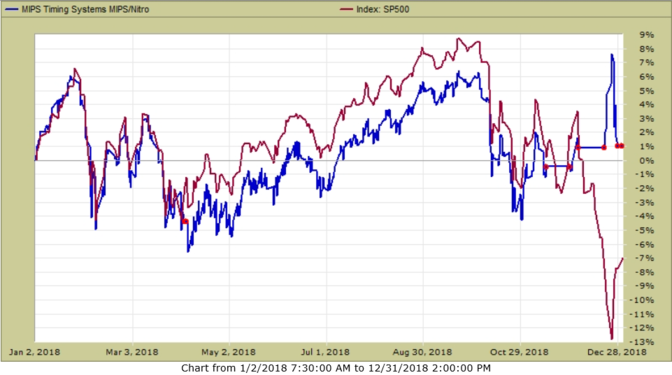
The performances of MIPS3, MIPS4, and MIPS/Nitro models were all positive and this continued through 1Q’19 (see the graph for MIPS/Nitro below). Note how Nitro avoided the big -13% dip at the end of 2018.
MIPS/Nitro Performance (2018 – 1Q’19)
- see below
MIPS +7.5% SPY +5.2

Good Trading…
Paul Distefano, PhD
CEO / Founder
MIPS Timing Systems, LLC
Houston, TX
www.mipstiming.com
281-251-MIPS(6477)
Tuesday, March 26 2019
I rarely do this, but I have a included below a copy of an article that explains the fallacy of last Friday's drop as a "tip" to what is coming a lot better than I can. The article explains how traders and algos can almost immediately move the market dramatically, and can come and go like the wind. They react to recent news almost immediately; even to events that may not happen until 6-18 months in the future, or not at all. They can easily trade a very high number of times each and every day. BUT, US "LITTLE GUYS" CAN'T TRADE LIKE THAT WITHOUT GETTING SLAUGHTERED (so, don't chase your tail).
|
Does #GrowthSowing Subbenly Matter?
By Dave Moenning on Mar 25, 2019 07:20 am (slightly modified)
One of my favorite sayings on Wall Street is:
"Things don't matter on Wall Street until they do. But then they matter a lot."
For example, the dueling issues of slowing growth and the flattening yield curve have been with us for quite some time now. In fact, we've known that global growth has been slowing for more than a year. We've known that the torrid pace of growth in the U.S. economy and corporate earnings would have to slow for almost as long. And we've been watching the yield on the U.S. 10-year fall steadily for the last 6 months.
On Thursday, March 21, 2019, the stock market appeared to make a meaningful break above an important resistance zone as the S&P 500 and NASDAQ both stepped lively to their highest respective closes since last October. To the bulls, this meant that investors were ignoring the current data (you know, the slowing growth stuff) and focusing on better days ahead.
After all, the Fed has reversed course and is now on hold, and the trade deal - the deal that the bulls hope will spark a resurgence in global economic activity - is expected to get done. All good, right?
Lest we forget, the stock market is a discounting mechanism of future activity. So, the bullish premise actually made some sense.
But then it happened.
On Friday, the yield curve (as defined by the spread between the yield on the U.S. 3-Month T-Bill and the 10-Year Treasury Bond) inverted. Meaning that the yield of the longer-dated bonds fell below that of short-term T-Bills.
Yep, that's right; what is known as the nearly infallible predictor of U.S. recessions flashed a sell signal on Friday. And apparently the algos knew what to do with that (yea, right).
Suddenly, the concept of #GrowthSlowing mattered. No one had given it a thought the day before. But now that the predictor of the last seven recessions here in the good 'ol USofA had flipped from green to red, this was suddenly a problem (as in a drop of -2% in one day kind of a problem).
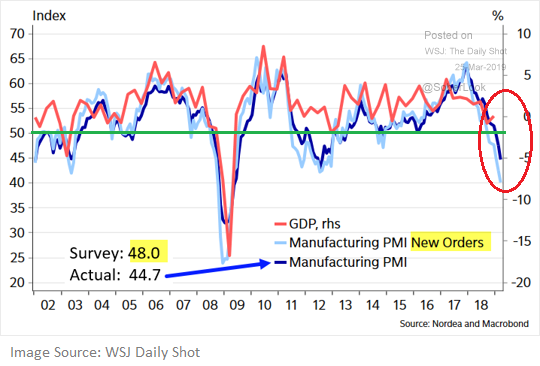
The impetus for the rather sudden concern about the yield curve was the nasty manufacturing data out of Germany and the Eurozone. In short, Germany's PMI, as calculated by IHS Markit, fell to the lowest level since 2012 and the New Orders component hit it's lowest reading since, wait for it... 2008. Ouch.
This report was accompanied by the fact that Germany's official GDP for Q4 came in at 0.0% and the PMI for the Euro area was the weakest since 2013. Now couple this not-so-hot news with some recent weak data in the U.S., the yield curve inverting, and word that the Mueller Report would be delivered imminently and well, things started to unravel pretty quickly Friday.
So, Is It Time To Worry?
Another WallStreet-ism that might be applicable here is:
"One day does not a trend make."
In this case, it is important to recognize that the yield curve inverting for a single day isn't "the" signal that a recession is about to happen (yea, like in the next 6-18 months). Especially in the era of high-speed trading (across all markets, around the globe) where things can - and often do - turn on a dime.
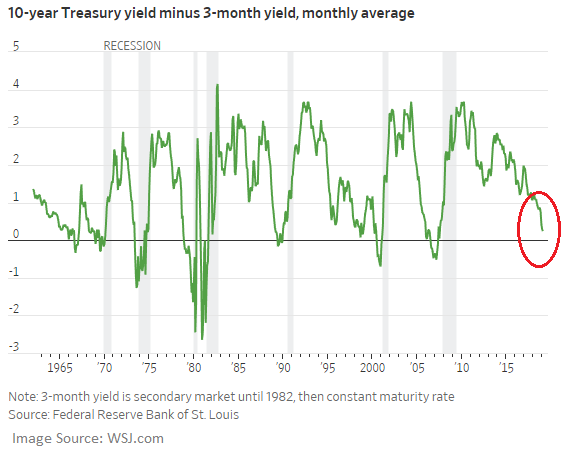
No, the point is that the yield curve will need to stay inverted for some time before we should view this as a harbinger of bad things to come.
The chart below makes this point clear. On a monthly basis, the yield curve has inverted before the last three recessions. But it also important to note that the yield curve has inverted at least eight times since 1965. And yes, six times recessions did follow. But the key here is that the indicator isn't perfect. Nor has it even flashed a signal yet (although we are just a week away from the latest update).
In addition, those seeing the glass as at least half-full can argue that there is generally a pretty decent lag (months/years, not days) between the time when the yield curve inverts and when a recession begins. As such, there is still time for good things to happen. You know, like a tremendous trade deal. Or lower rates to encourage home buying and capex. Or action by the central bankers of the world. Or for the data to improve.
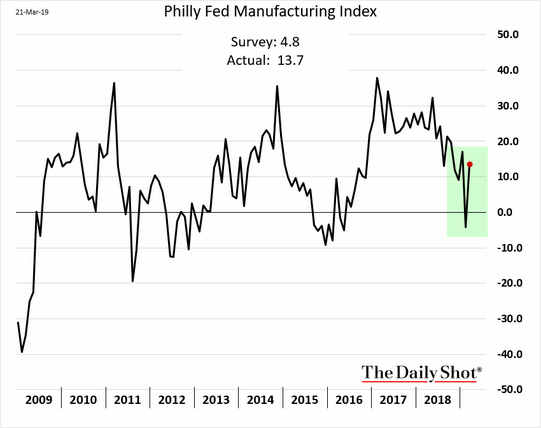
On that note, don't look now bear fans, but last week's Philly Fed report actually rebounded nicely in March.
In addition, the recent report from the Conference Board's Leading Economic Indicators came in above expectations. As did the latest data on Existing Home Sales.
Speaking of the data - particularly the U.S. data, that is - let's also keep in mind that the long government shutdown likely impacted the efficiency/accuracy of some of the numbers. So, there's that.
To be sure, the trend of a lot of economic data has not been going in the right direction. As such, it will be important to keep an extra close eye on the data in the coming months. Because in short, if the trend can turn (or at least flatten out) then the risk of recession in the U.S. declines.
The Key Point
My key point on this fine Monday morning is that from a macro point of view, nothing changed on Friday. There was no new information provided. That is, everybody knows that growth has been slowing.
The question we should be asking is if the slowdown is going to get worse. Remember, the U.S. economy is driven by the consumer. And the bottom line is consumers like to spend money. Unless, of course, there is a crisis that puts their jobs or the economy at risk. Then they tend to stop on a dime and wait to see if everything will be okay. But then it's back to the malls and to all those shopping sites.
So, will the inverted yield curve become reason enough for traders to move to a risk-off mode for a while? Sure, that could certainly happen. The big boys and girls on Wall Street do love a good bout of volatility to spruce up their trading returns.
But for most of this year, investors (the folks with an investing time frame beyond lunch that day) have been looking at the bright side. And unless something bad actually happens, I (Moenning) would expect to see this continue. Once the dust settles, of course.
---------------------------------------------------
MIPS - At any rate, we don't have to worry because we have MIPS to tell us what to do... Stay tuned...
Paul Distefano, PhD
CEO / Founder
MIPS Timing Systems, LLC
Houston, TX
281-251-MIPS(6477)
|
|
Thursday, March 21 2019
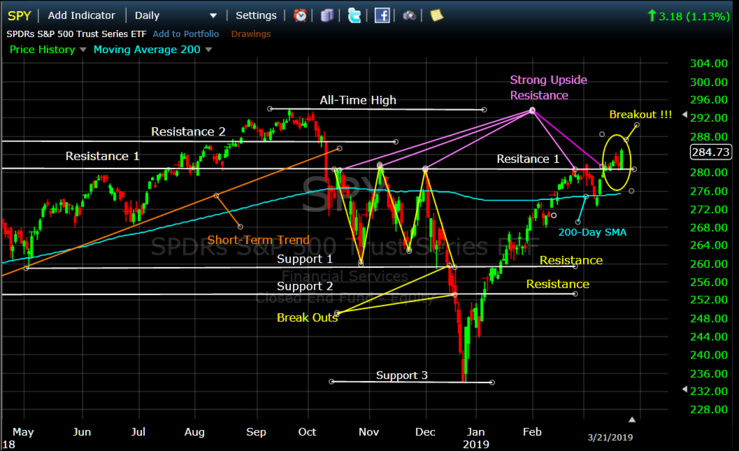
From the previous email below dated 3/15/2019, you can see that the SPY (S&P 500 Index ETF) has been trying to break above its tough upside resistance level at $281/share for several weeks. Today's graph immediately below shows that after trying for 18 days, the SPY strongly broke above this resistance level today and closed very near $285.
The All-Time High for the SPY sits at $294 (set in Sept'18). That is only 3.5% above today's level. I believe that it is almost a given that the SPY will move up in the next few weeks to test that level. And, if the SPY breaks above $294/share and holds for a few weeks, we can look for another good run up.
The MIPS1234 and MIPS/Nitro signals are all Long now, but stay close...
Let's hope for new highs in the next few weeks, but wait for MIPS to tell us what to do...
Good Trading...
Paul Distefano, PhD
MIPS Timing Systems, LLC
Houston, TX
281-251-MIPS(6477)
www.mipstiming.com
Friday, March 15 2019
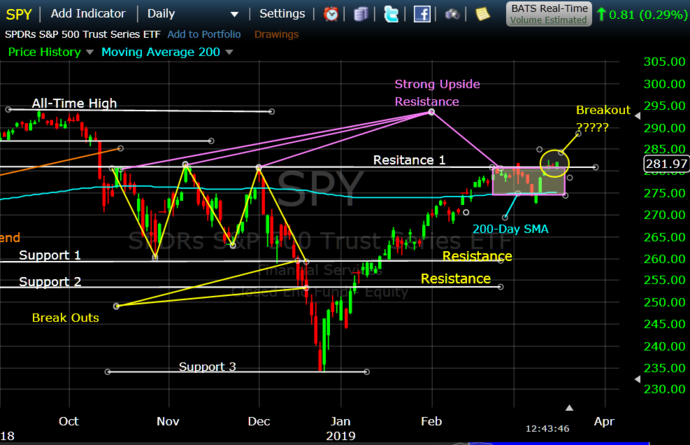
This may be the "Breakout" for the SPY that we have all been waiting (and hoping) for:
- see purple box on the middle right in the graph below
1) The SPY climbed to and hit the Resistance 1 level at $281/share,
2) and it stayed around there for about 7 days,
3) then in the next 5 days the SPY dropped to the 200-Day SMA level for support, and
4) moving average support held, and SPY rebounded back up to (and slightly above) Resistance 1 again.
|
Let's hope for new highs next, but wait for MIPS to tell us what to do...
MIPS1234 and Nitro are sall till Long.
Good Trading...
Paul Distefano, PhD
MIPS Timing Systems, LLC
Houston, TX
281-251-MIPS(6477)
www.mipstiming.com
Tuesday, March 05 2019
There is a lot of talk (and a lots of good reasons) why we should strongly consider the possibility of, and even expect, the end of this market rally and/or the end of this 10 year bull market.
Current Rally
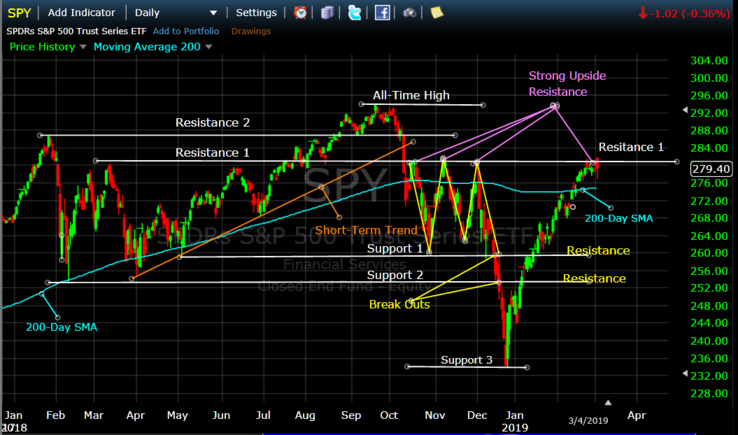
First, the current rally in the S&P 500 (SPY) has been "on" for two strong months (up over 20%) without looking back, and is now being challenged by strong resistance at $281/share. As you can see in the graph immediately below, the SPY has tried to break above $281 for the last 5 days in a row, and has failed to do so. And, exactly $281/share was the strong resistance price to the upside in the previous three rallies in 4Q'18. So, what's next?
Longer-Term
There are a multiplicity of reasons why the long-term bull market that we have been in since 2009 may be coming to an end. We have what feels like the strongest political unrest in decades, the Fed and interest rates, China tariffs, overbought markets, slower earnings growth, etc. We are all aware of these and there is no reason to repeat them herein.
There is one other thing brewing that all investors should be aware of that could lead to a correction soon or even be the catalyst for a serious bear market. This threat is "Margin Debt". Margin Debt, of course, is the money that large investors and institutions have borrowed (hence, debt) to buy or short more equity positions than they have "real" money to cover. For example, qualified investors can buy $2,000,000 in equities with the $1,000,000 in cash they actually have (2.0x leverage) by "borrowing" the sceond $1,000,000 (debt). This is great ride when the market is going up. But with 2.0x leverage, if the equity they own drops say 25%, they will have lost 50% of their initial investment.
The above is why Margin Debt is dangerous for investors who owe the debt AND for us that don't. It is dangerous for these investors because of their leverage and it is dangerous for us because when the market goes against the investors who owe the debt (mainly very large investment firms and hedge funds), they run for the hills and drive the market down much quicker than normal (and innocent buy and hold investors can get cremated along the way).
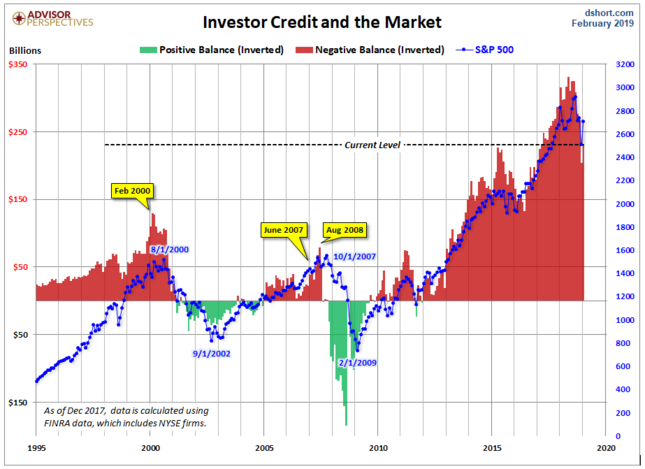
Warning
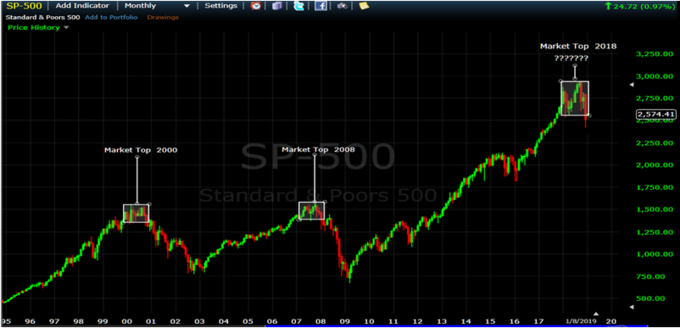
Margin Debt is at an all-time high from all views (like total debt, or debt as a % of ownership, etc). See the graph below. The current level of debt is staggering, especially when compared to 2000 and 2008.
Observation
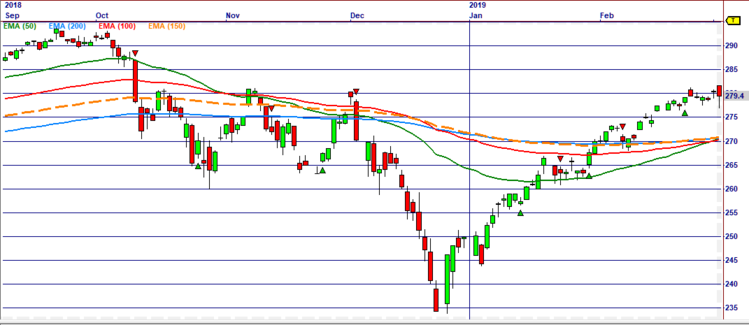
When stock markets roll-over from up-to-down, its moving averages roll-over from where the short term moving averages (50-day) are on the top and long-term averages (200-day) are on the bottom to where the short-terms are on the bottom and the long-erms are on the top. And, vice-versa for markets that move from down-to-up.
Note that in September 2018 the market was going up and the 50 was above the 100, and the 100 was above the 150, and the 150 was above the 200. Then, as the SPY tumbled in 4Q'18, by mid-December the moving averages had changed places with the 50 on the bottom and the 200 on the top. Since then, with the current rally, all moving averages have merged to the same price today, which kind of puts all market direction forecasts back to ground zero. So, where does the market go from here?
Wow, what can normal investors like us (the little guys) do in times like this. MIPS told us what to do in 2008 and we were up over 50% when the market was down more than 50%. So, we are going to wait for MIPS to tell us what to do in 2019.
Paul Distefano, PhD
CEO / Founder
MIPS Timing Systems, LLC
Houston, TX
281-251-MIPS(6477)
Sunday, February 10 2019
Interesting market movement last week:
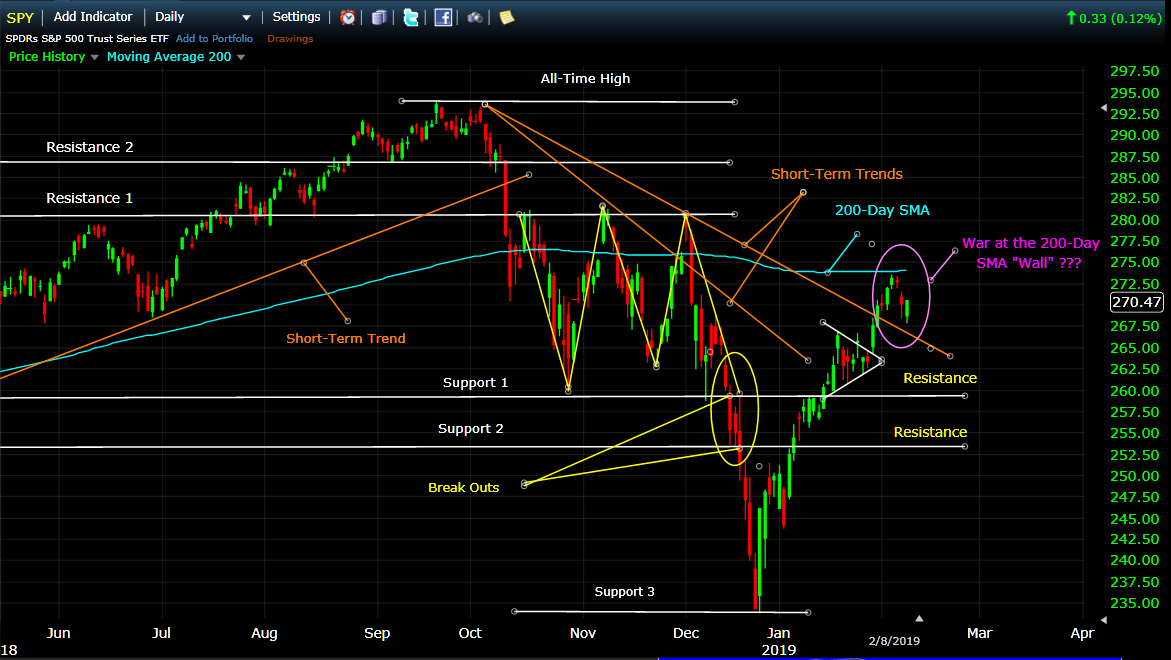
As expected, the market ("SPY") declared a "War on its 200-Day Moving Average Wall" when it made an upward assualt on its 200-Day SMA. Sad to say, this first charge failed to break above the 200-Day SMA (see the purple ellipse on the right in the graph below). This market is fast moving and can go anywhere from here, so stay tuned, and
... let's wait for MIPS to tell us what to do next...
Paul Distefano, PhD
CEO / Founder
MIPS Timing Systems, LLC
Houston, TX
281-251-MIPS(6477)
Tuesday, February 05 2019
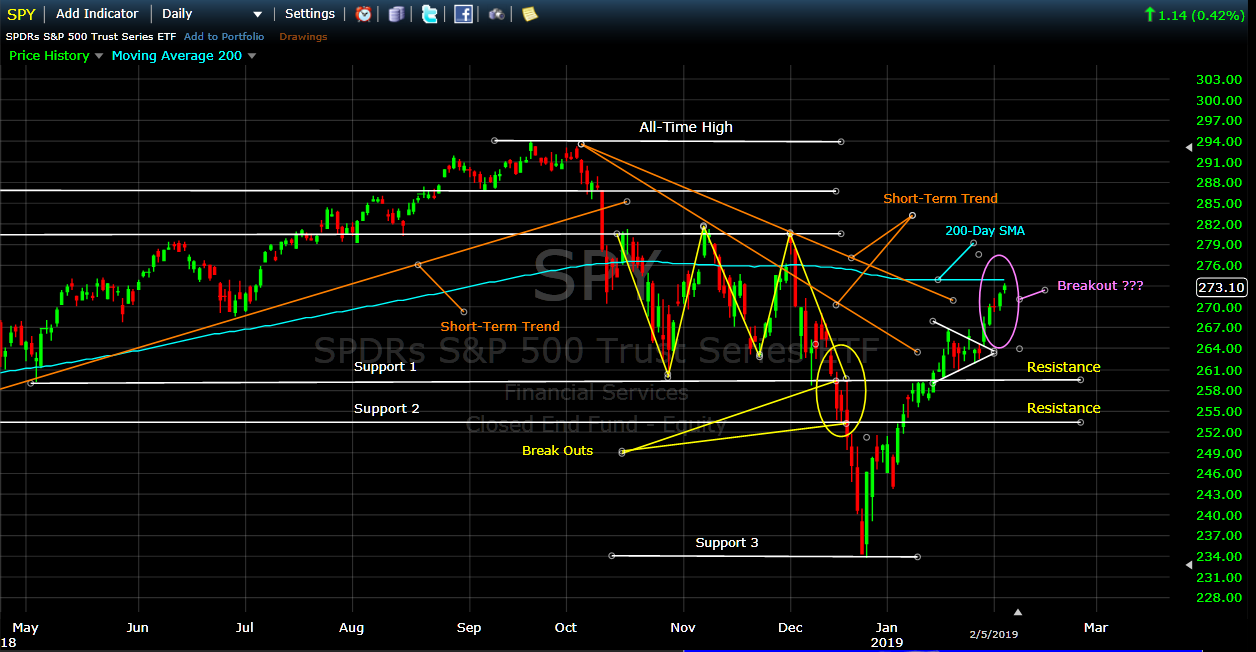
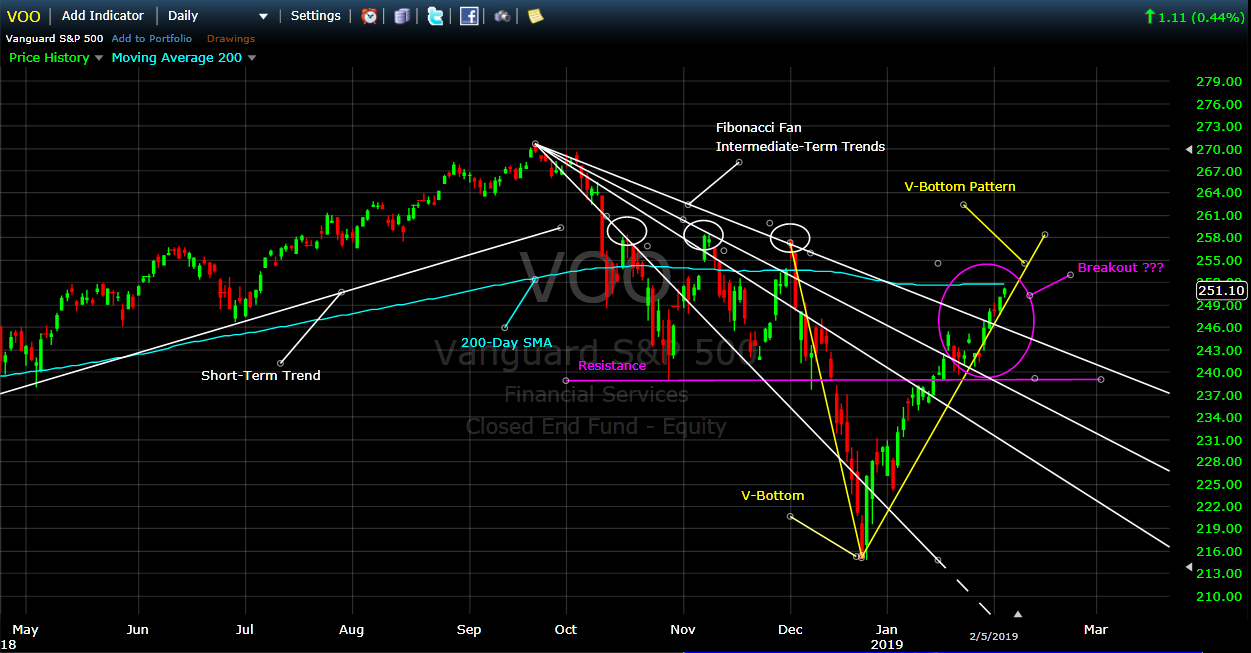
What are the charts below trying to tell us to expect (see purple ellipse on right hand side):
1) continued breakout to the up-side (following the V-Pattern) to new highs, or
2) stiff upside resistance at the 200-Day Simple Moving Average level, and maybe a test of previous lows.
Stay tuned:
- I am going to let MIPS tell me what to do, and you should do the same.
Graph #1
Graph #2
Paul Distefano, PhD
CEO / Founder
MIPS Timing Systems, LLC
Houston, TX
281-251-MIPS(6477)
Sunday, January 27 2019
Some time ago, I would have been surprised at the negative inputs that MIPS is getting from "some" (small number) of its members because of the high number of trades (9 trades) that the MIPS models have issued in the last 90 days. But, I am really NOT surprised because we had almost an identical response from other members in 2017 when the MIPS models did the opposite, and had No trades for the entire year (yes, zero).
In this blog, we will attempt to explain the high number of trades from MIPS in the last 90 days; and we will refer to our previous Blog from Nov 19, 2017 to explain the lack of MIPS trades in 2017. Over the last 13 years, the MIPS models have averaged about 12 trades/year, with 20+ in some years and 0-2 in others.
Popular quantitative models are based on concepts such as:
1) Trend Following - following short, intermediate, or long-term trend lines
2) Reversion to the Mean - Reverses when the markets get over-bought or over-sold
3) Momentum - puts more trust in markets that are moving in one direction, with higher or lower movements
4) Rate of Change - highly affected by markets when the slope of the movement is growing or decaying,
5) etc, etc, etc.
MIPS
MIPS is basically a trend-following model, but has algorithms built in to recognize over-bought and over-sold markets, markets that are gaining or losing momentum, and especially markets that are moving sideways (forming a recognizable "Consolidation Pattern").
MIPS behaves differently in slow and fast moving markets, up markets, down markets, and flat/sideways markets. In 2017, the market moved as a strong up-market for the entire year, so there was no need to "trade" just to trade, at the risk of being "fooled" by small dips. So, MIPS detected that, and did not trade at all that year.
On the other hand, since 3Q'18 we have been in a flat/sideways market. This is VERY dangerous market pattern, because there are basically NO identifiable trends (flat trend), and most other indicators are in chaos also. In fact, trying to identify market direction in this type of market is like trying to figure out who is winning a battle of thousands of warriors in hand-to-hand combat !!!
In this type of market, the MIPS models are programmed to go into a "preservation of capital" mode; which essentially means that, to be "safe", the models will go into (and stay in) Cash more often. So, instead of trades being long-to-short, most will be long-to-cash-to-short (and vice-versa for short-to-long trades). With this approach in 2018, the MIPS models ended up with small gains instead of big losses from getting whipsawed like many other quantitative models.
MIPS Gains in the last 3 years
The goal of all timing models should be to keep up with (or do a little better than) the market (S&P 500) in up markets, and to beat the market (or at least not lose money) in down markets. If you want to beat the market in strong up markets, you should do so by trading with 25% (1.25x) leverage or 50% (1.5x) leverage on Long Signals. On Short Signals, you should traded with 0.5x or 1.0x leverage.
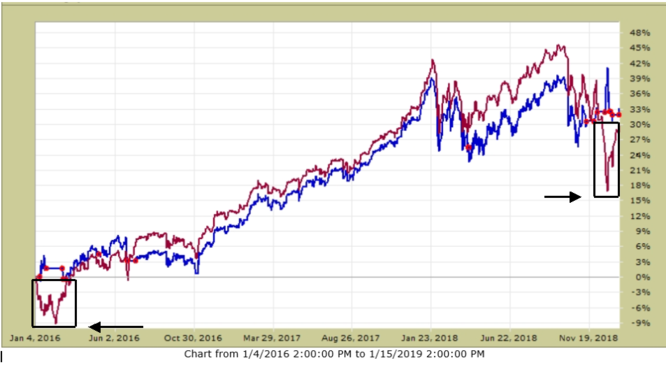
Overall, since the beginning of 2016 thru 01/15/2019, MIPS is up about 33%, while completely avoiding the big drops in the beginning of 2016 and in the last few weeks in 2019. Of course, this means if you were trading with $100,000 you would have ended up with about $33,000. Not bad since your trading advice from MIPS would have been only $39 or $59 per month for 3 years !!!
2016 - 01/15/19
MIPS - Blue Line
SPY - Red Line (big drop boxes are drops in the SPY)
Red dots show actual trades
2008 - Market Crash
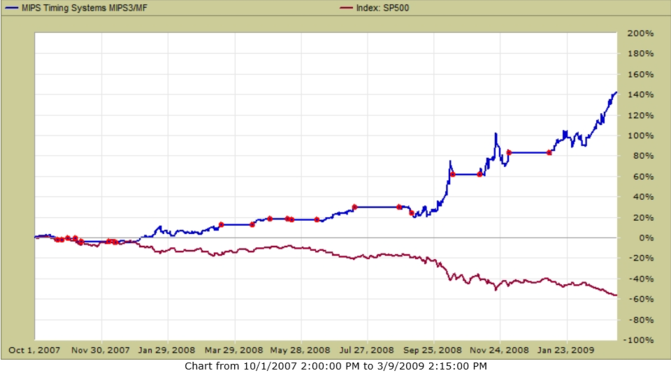
With good quantitative models, the "magic" comes in down markets. Notwithstanding the analysis above the graph above, the big payback comes in unanticipated years when the market crashes, as in 2008. The graph below shows what MIPS would have done for you in 2008, with no leverage.
In the 2008 crash (4Q'07-1Q'09), with MIPS Signals you would have been up +140%, while with buy-and-hold you would have been down -55% (yes, LOST 55%). Again, while investing with MIPS signals your $100,000 investment in Oct'07 would have been $140,000 at the end of 1Q'09 (+40%). On the other hand, with buy-and-hold your $100,000 investment in Oct'07 would be $55,000 at the end of 1Q'09 (-45%). That's a spread of $85,000. You do the math and see if that performance would be worth $39/month !!!
2008 Crash
MIPS - Blue Line
SPY - Red Line
Red dots show actual trades
BTW, trading just the SPY and SH (or any other two ETFs), it should take only 10 minutes to make a trade. So, 12 trades/year (24 round trip) would use up a max of only about 4 hours of your time per YEAR. If you cannot or will not spend that much time managing your life savings, you should either buy-and-hold or hire a money manager (most charge a fee of about 1.5% er year, and require a minumun investment of about $100,000).
Best Wishes !!!
Paul Distefano, PhD
CEO / Founder
MIPS Timing Systems, LLC
Houston
281-251-MIPS(6477)
www.mipstiming.com
===========================================================================
<<< Previous Blog >>>
Saturday, November 18 2017
Some investors (including some MIPS members) seem to think that when there is not a position change (Signal Change) in a MIPS model for a long period of time, they are being ignored or something is wrong with the model that they are following. They can't seem to understand that a good model (like MIPS) only changes position when the market changes its behavior, and that change is detected by the model. With MIPS, this would be when the intermediate-term market "trend" changes direction. We at MIPS input data and run our models daily (in triplicate), independent of whether or not there is a change of any type.
All daily model developers (including MIPS) provide their subscribers with "Investment Positions" (Long or Short or Cash) about 250 days every year (52 weeks/year x 5 trading days/week - holidays). This is not a function of how often their models trade.
There is, however, a big difference in how these "Investment Positions" are reported amongst model developers (aka Signal Providers):
1) Some Signal Providers send out emails to subscribers with current positions every trading day, whether or not the signal has changed. Many subscribers do not like this because they get inundated with emails from their Signal Provider and many times they miss a "signal change" due to confusion or boredom.
2) Other Signal Providers only send out emails to subscribers when there is a change in position from their model. Subscribers don't like this because there can be long periods of time (weeks/months) when they don't hear from their Signal Provider, and hence they are not 100% sure that they did not miss a signal change somewhere along the way or that the Signal Provider is now inactive.
3) At MIPS (as with most other good Signal Providers), we send out
(a) A "Signal Change" email the very day that one of our models calls for a change in position
(Long-to-Short or Short-to-Cash or etc.)
(b) A "Signal Status" email every weekend showing the current position for all MIPS models.
Our subscribers like this because the "Signal Status" tells them if they are in the correct
position at that time.
The moral of this story is that MIPS runs its models each and every day, no matter what the market is doing. This includes the status and behavior of hundreds of technical indicators and mathematical equations, and thousands of calculations. it is NOT any easier to run the model when the current signal remains the same or when there is a signal change.
We report the results to you every time there is a Signal Change, with instructions on our website for you NOT to change this new position until there is another Signal Change issued by the MIPS model that you are trading with. In the meantime, we keep you up-to-date on the Signal Status for each MIPS model every weekend, in case you accidentally did not act on the latest Signal Change during the week.
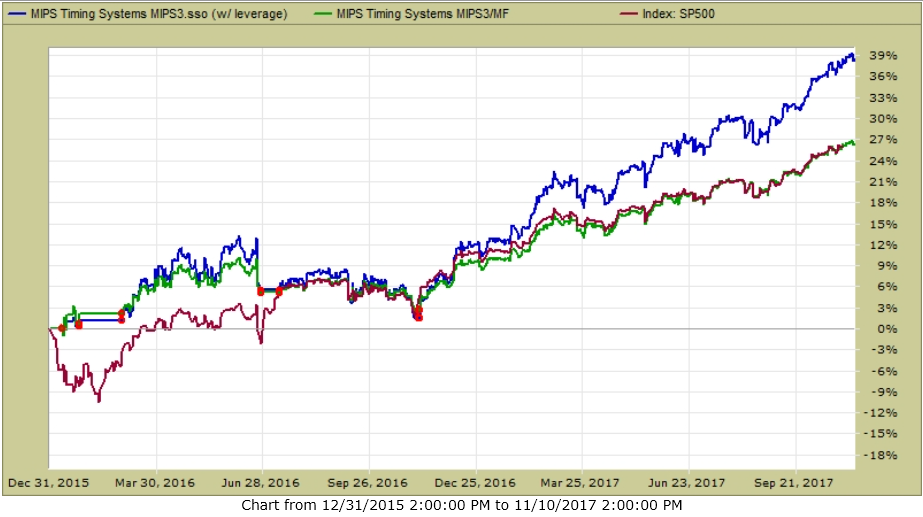
Here are the trades (red dots) and performance of the MIPS3 model since 2016
Blue Line - MIPS3 1.5x Long / 0.5x Short +39%
Green Line - MIPS3 1.0x Long / 1.0x Short +27%
Red Line - SPY........................................ +27%
Red dots show actual trades
Best Wishes...
Paul Distefano, PhD
MIPS Timing Systems, LLC
Houston, TX
281-251-MIPS(6477)
Tuesday, January 15 2019
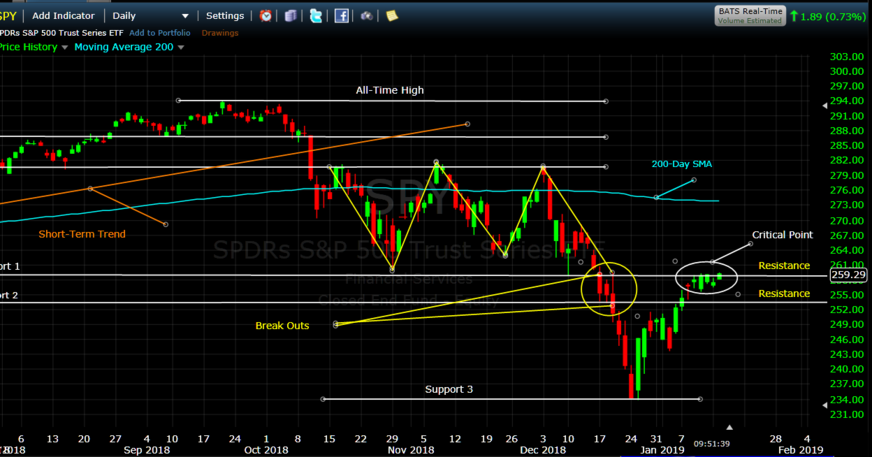
Today is a critical day in 2018-19's sideways market's short-term future. These type of sideways markets (also called "Flat Markets" or "Consolidation Patterns", etc.) usually have no direction, trend, etc. So, MIPS handles these with "Preservation of Capital" algorithms, rather than "Capital Gain" algos. In this blog, we use SPY (SP500 ETF Index) to represent "the Market".
For the SPY to go back to all time highs following a "Correction" (as in 2018), it must pass through multiple "upside resistance levels" where the market stalled on the way down. [BTW, these were called "support levels" on the way down.]
Today is what I call a "Critical Day" because the SPY is at an upside resistance level where it has "stalled" for the last five days in a row (and these attempts to cross over upside levels are not that tolerable). So, for the latest mini-rally to continue, it is very improtant that the SPY closes above its resistance level at about $259/share today or in the next few days.
See the botton right in the 2nd graph below...
COMPLETE SIDEWAYS MARKET
CRITICAL POINT TODAY
Stay tuned... MIPS had a surprise for you today... did you check your email last night or this morning?
Paul Distefano, PhD
CEO / Founder
MIPS Timing Systems, LLC
281-251-MIPS(6477)
www.mipstiming.com
pdistefano@mipstiming.com
Wednesday, January 09 2019
2018 was an unusually volatile market with all hell breaking loose in the 4th quarter. If we need an explanation, the catalysts would again be the Fed raising interest rates, tariffs, trade agreements with China, Mexico and Canada, domestic and international political unrest, etc. And, it is indeed odd that this happened when the economy is still in relatively good shape. For example, in December 77% more new non-farm jobs were created versus the prior period. If the economy had any impact on the market, it would be because the troublemakers made up any and all excuses to scare investors into thinking that the economy is weakening, thus causing a sell off. Then the fat kats come back in and buy at prices much lower than what would have been possible before.
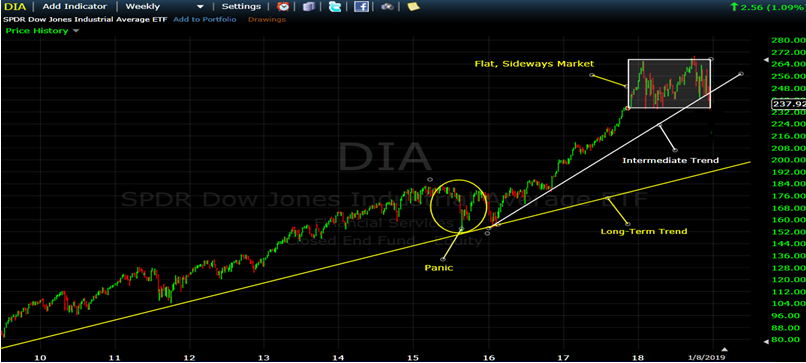
That said, the market is beginning to look like it is entering a “topping" pattern that we have seen before in each and every major market crash in the last 20+ years. In 2015, the Global Central Bank interventions prevented or postponed a crash. Crashes don’t normally happen suddenly and quickly; they usually waffle in a tight trading range (like plus to minus 6 to 7%), and then they drop like a rock. Is that what is happening now? I don’t know, but we should find out in a relatively short period of time from here.
.
The 4th Quarter was a Disaster !!!
Meet the monster…
The market volatility type in 4Q'18 is one of the most difficult for quantitative models.
Some of the major problems weree:
1) Trendless - a flat or sideways market has no trend. The slope of the trend is near zero, so any small
deviation from the trend could seem to signal a "direction change", and this can lead to a series of
“whipsaws”.
2) Oversold and overbought conditions do not register nearly as often as the market changes direction
quickly.
3) Reversion to the mean signals could trigger at tops in sideways patterns that happen in an up market,
but they rarely trigger on market bottoms in these type markets.
4) Since most models available to large individual investors and RIAs are based on daily data (instead
of like minute-by-minute or second-by-second data), it can take a few days for models to issue a new
buy/sell/cash signal. And, when sideways markets are changing direction every few days (high-
frequency-directional-changes), the market can change direction a day or two after each trade is
executed, time after time. We all know what that leads to, and it is NOT pretty.
MIPS Performance in 2018…
Actually, MIPS performed OK in 2018 (like, did not lose money in a down market). MIPS was up about +1%, while the S&P 500 was down about -7%. Many other quantitative models took a beating in 2018.
From TimerTrac.com MIPS +1% Standard & Poors 500 -7%
Red dots represent "trades"...
Here Comes 2019…
2019 is starting off with a Bang...
.
China remains a headache but it is not overbearing. And, our economy remains strong.
There are billions of dollars flowing back into the market so far in Jan’19. The market got a boost from the Fed after Chairman Powell said the Feb will be “flexible and patient" regarding rate hikes in 2019. Last Friday, earnings reports showed 312,000 new jobs created in December versus 155,000 created in November, and 180,000 “expected” in December. Can’t beat that !!!
In 4Q’18, Corporate earnings growth has average 15.4%, with Corporate revenue growth of 6.2%. Average hourly wages rose 0.4%, the largest gain in 4 months. The year-over-year wages growth is about 3.1%.
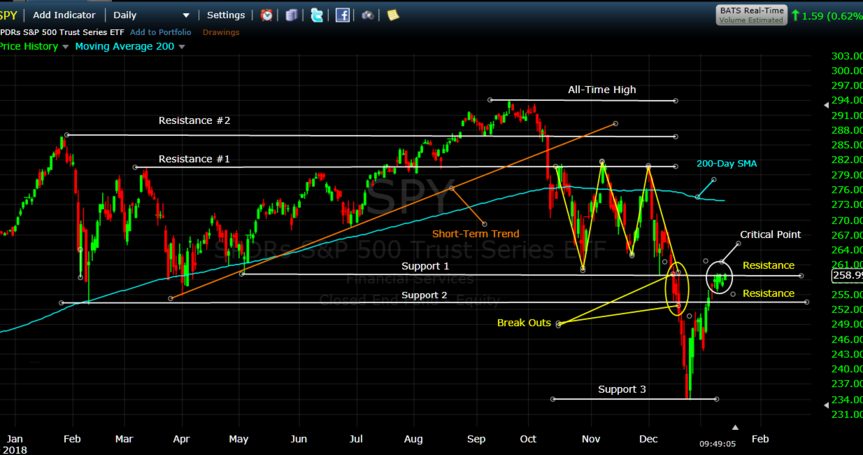
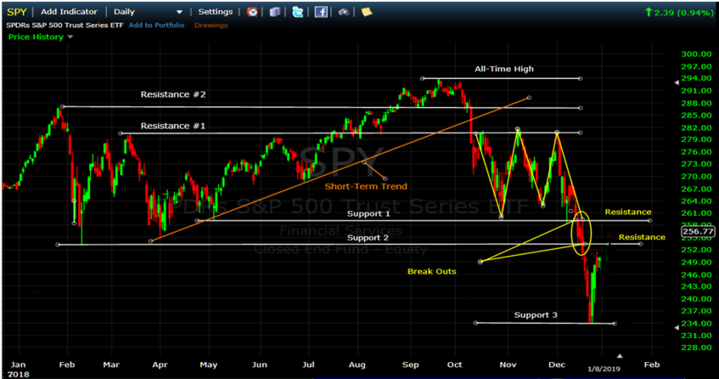
After a strong recovery in the last four days in Dec’18 and in the first six days in Jan’19, the SPY has “recaptured” a little over 50% of the “drop” that started in early Dec’18. See graph and text below...
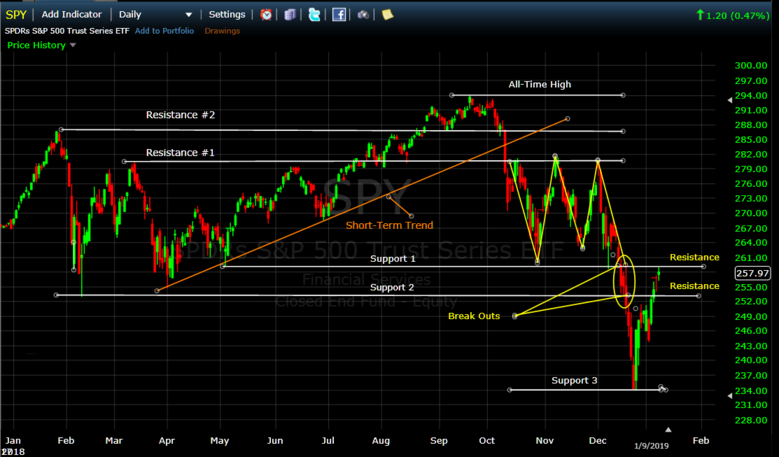
The challenge going forward is for the SPY to break above the second Resistance levels on the right hand side of the graph above. On Monday (Jan 7th) the SPY broke above its first Resistance level at 253.1; and then it stalled right on the second Resistance at 259.1 today (Jan 9th). It is highly likely that the SPY may stall at this level for a few days or even drop back below it.
On the other hand, if the SPY breaks above 259.1, it would most likely move up significantly to test its higher resistance levels shown above (or even move into new high territory). Although not expected at this time, the SPY could of course, just as easily head back down to test the support levels below today’s price. That could result in a drop to 234.1, or lower. And, it if breaks that level, we will head for the hills (that is, go Short and make money).
Stay tuned. It’s anybody’s guess, but MIPS is watching…
Good Trading…
Paul Distefano, PhD
CEO / Founder
MIPS Timing Systems, LLC
Houston, TX
www.mipstiming.com
281-251-MIPS(6477)
|


