As Q2’16 came to a close, this blog turned out to be completely different from what I had planned a week before. Of course, this quarter’s D-Day for stock markets all over the world was the vote by the Brits to leave the EU (the so-called BREXIT). With the Brits voting to leave, the worldwide performances for the quarter were severely damaged in one day. Compared to this, all other topics are boring. Since the BREXIT vote, the markets have rebounded some, but not with enough time to recover the entire BREXIT losses before the end of the 2nd quarter.
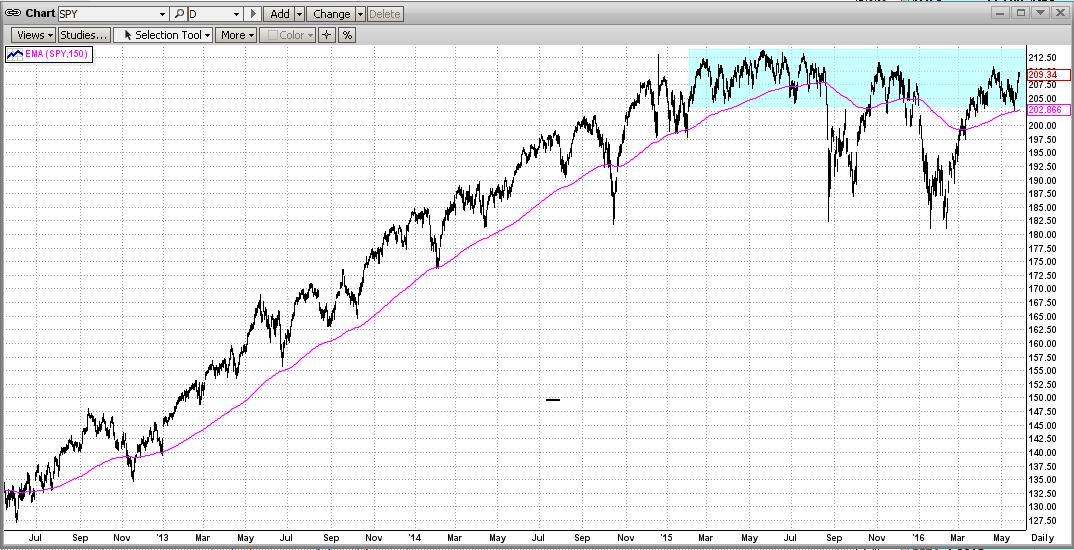
My fear is that the rebound is only temporary, simply because the “Market to Nowhere” (in the case the S&P 500) is approaching its VERY STRONG resistance level at its all-time closing high of 2135 (and its Intraday high of 2140) again. This is something that the market has tried to break, and failed to do, over ten times over the last 17 months.
This record flat tight-trading range should be the main topic of Q2’16 as it has been for over the last 18 months. There are some very serious reasons for this strange, rare market behavior. Take a few seconds to look at the graph below and concentrate on the blue rectangle on the top right. This blue consolidation pattern represents a FLAT trading range of roughly plus and minus of 2.4% for nearly one and one-half years, with two big drops in between. That is phenomenal and very rare. Remember, this means that when the market is in a tight pattern like this, and you do not trade at all during the entire period, it would not matter much if you stayed long, short, or in cash. On the other hand, if an investor tried to trade this market, they could have ended up getting whipsawed mercilessly.
“Big Picture” Outlook
In the graph above, you can see that the two big moves to the downside, below the trend line and/or through the bottom of the blue trading pattern, were fast and deadly (that is, volatile and deep); whereas the moves to the upside got slapped back every time the market approached its all-time high. This says to me that most large investors may be expecting a big drop, and have little or no confidence in the market making new all-time highs.
Yellen’s Up Market
But, please do not underestimate the immense power that the “Master Market Manipulator” (Federal Yellen) has over the stock markets. If Yellen wants the market to go up (or at least to not go down), she will simply repeat what she has concocted to make her “black magic” successful over the last 7 years. This time, however, if the market does break to the upside, the sky is most likely the limit !!!
Extremely Strong Resistance
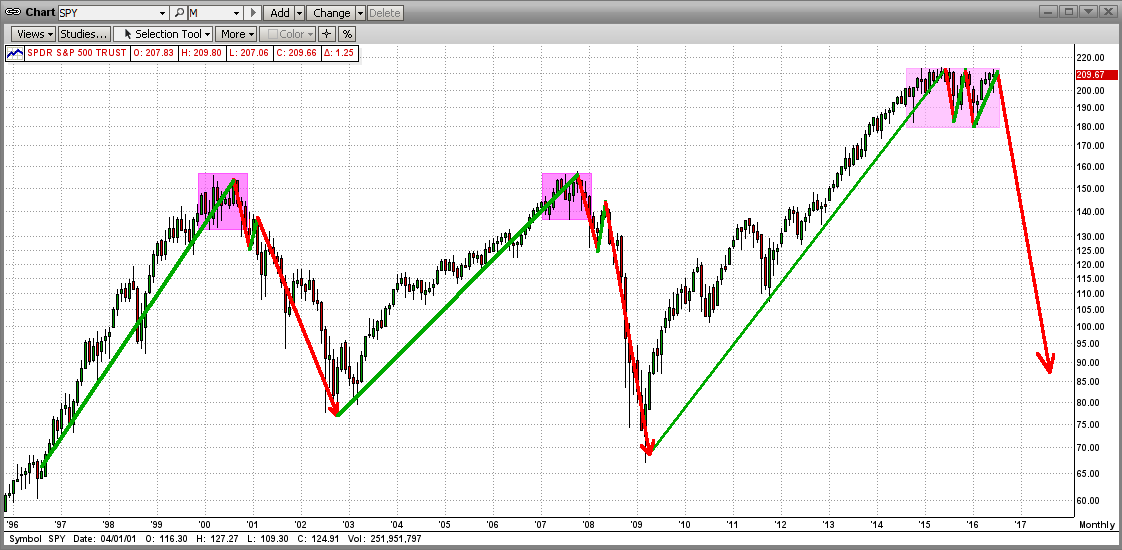
On the other hand, even with Yellen’s help, breaking the all-time high of 2140 on the S&P 500 will be like breaking through a 10-foot-wide steel wall. The Bears are lined up there with all of their guns loaded (sell orders) and are ready to fire when they can “see the whites of their eyes”. The end result of this could be another “topping pattern” as in 2000 and 2008 (see graph below).
In 2000 and 2008, the markets waffled (“topped”) in a tight consolidation pattern for 10-12 months before breaking to the downside and crashing 40-50%. In 2016, the market has been “topping” in a very similar trading range for almost 22 months, and could be getting ready to dive.
Be careful !!!
Preservation of Capital Rules...

MIPS Models
After the big one-day “hit” from the BREXIT on 6/24/2016, the performance of our MIPS4 model:
a) trading 1.0x SPY Long and 1.0x SPY Short, and
b) trading 1.5x SPY Long and 1.0x SPY Short, and
were near breakeven for 2Q’16, but they remained up about +1.5 and +3.0% YTD in 2016, respectively.


