The one "indicator" that is almost 100% accurate notes that:
"Markets Don't Crash when Economic Fundamentals (like profits) are Good" !!!
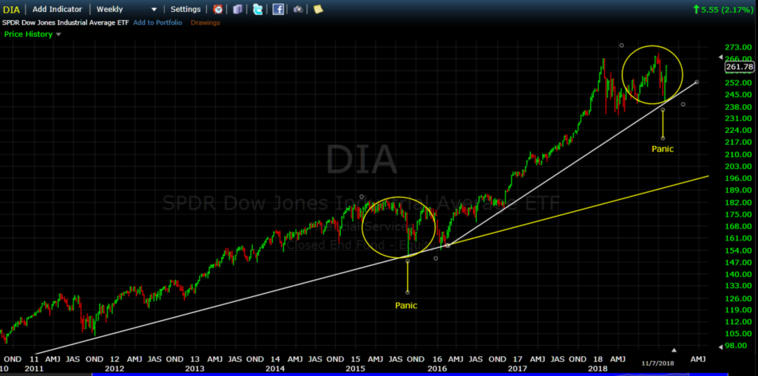
Since the Presidential election in 2016 to the mid-terms in 2018, corporate profits and jobs have risen at a rapid pace, followed by almost a "straight-line" in rising stock prices. Take a look at the Dow graph immediately below. Who would have wanted to sell or go short in a market like that since the beginning of 2016 ?
Yes, there were some big dips along the way, but they were ALL above the trendline. Please understand that a drawdown above the trendline is NOT the same as a drawdown below the trendline. Since Jan'18 the market has moved in a "sideways" pattern, which is a perfect market to get whipsawed in by trying to time and trade the ups and downs in a tight, volatile pattern.
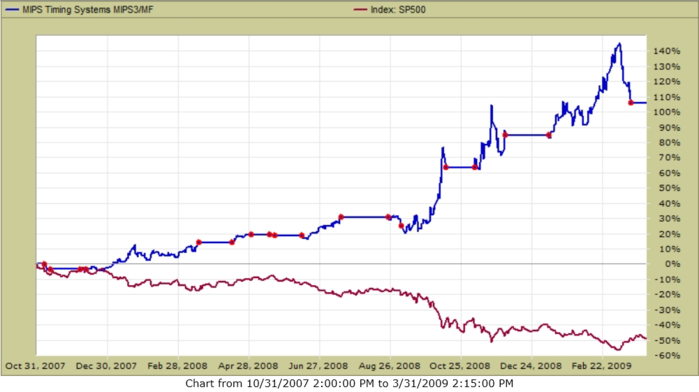
In markets when it was "the right time to go short" as in 2008, MIPS did its job and was up more then 100% when the SPY dropped 50%. Tests show that MIPS would perform in a way similar to that again in the next market crash.
2008
MIPS is a trend-following model and as such it has a "bias" to market trends above the trendline (as it should). Since the Nov'16 elections, the MIPS models have not traded very often, mainly because the market has closely followed a tight, solid upward trend for the last 10 years, with even higher upside acceleration since Nov'16.
Some MIPS members have questioned our low number of trades in the last two years, but there were simply very few good, technical reasons to do so. And, please remember that whenever MIPS stays with the same signal (like our few Long signal in the last few years), it is not because MIPS is in any way "following" past signals. The MIPS models go through several 100's of calculations every day to determine the direction of the market. And, when the trend is up, the MIPS signals are Long and vice versa when the trend is down. Of course, it makes no sense to trade more times in any give year than the number of times that the trend changes direction!!!
Aside from that, third party "Tracking Companies" (like TimerTrac.com) post evidence that models that trade more than like 20-40 times/year often do very poorly over a long-term period. MIPS3 is the #1 Model on TimerTrac.com since 2007 (up over 400% with 131 trades in the last 11+ years); whereas the model in 25th place was up only 35% with 1393 trades in these 11+ years. There are other models that have traded over 100 times/year that have performed poorly or even lost money in this same time period. Go to => https://www.mipstiming.com/bu___1_ranked
Notwithstanding the above, here is how has MIPS3 performed since the Presidential election in Nov'16:
MIPS3 - trading SPY Long/Short (no leverage)
SPY
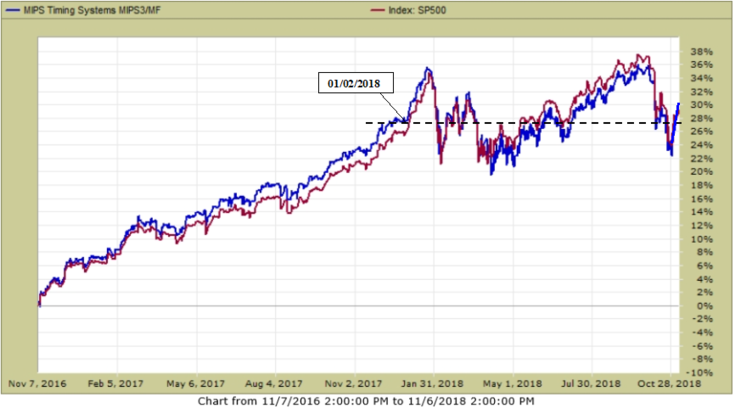
As you see above, MIPS3 is up about 30% since the Presidential election in Nov'16. It "weathered the storm" and was up a little in the sideways market in 2018. This is quite an accomplishment, because many models that tried to trade this volatile, trendless market long and short in 2018 got cremated.
So, the moral of the story is: "Do not take this journey by yourself". Find a good timing model, or simply use one of the very best models on the retail market, MIPS4 (or MIPS3).
Good trading...
Paul Distefano, PhD
CEO / Founder
MIPS Timing Systems, LLC
Houston, TX
281-251-MIPS(6477)


